Indonesian vs Immigrants from South Eastern Asia 3 or more Vehicles in Household
COMPARE
Indonesian
Immigrants from South Eastern Asia
3 or more Vehicles in Household
3 or more Vehicles in Household Comparison
Indonesians
Immigrants from South Eastern Asia
18.3%
3 OR MORE VEHICLES IN HOUSEHOLD
3.5/ 100
METRIC RATING
237th/ 347
METRIC RANK
23.1%
3 OR MORE VEHICLES IN HOUSEHOLD
100.0/ 100
METRIC RATING
30th/ 347
METRIC RANK
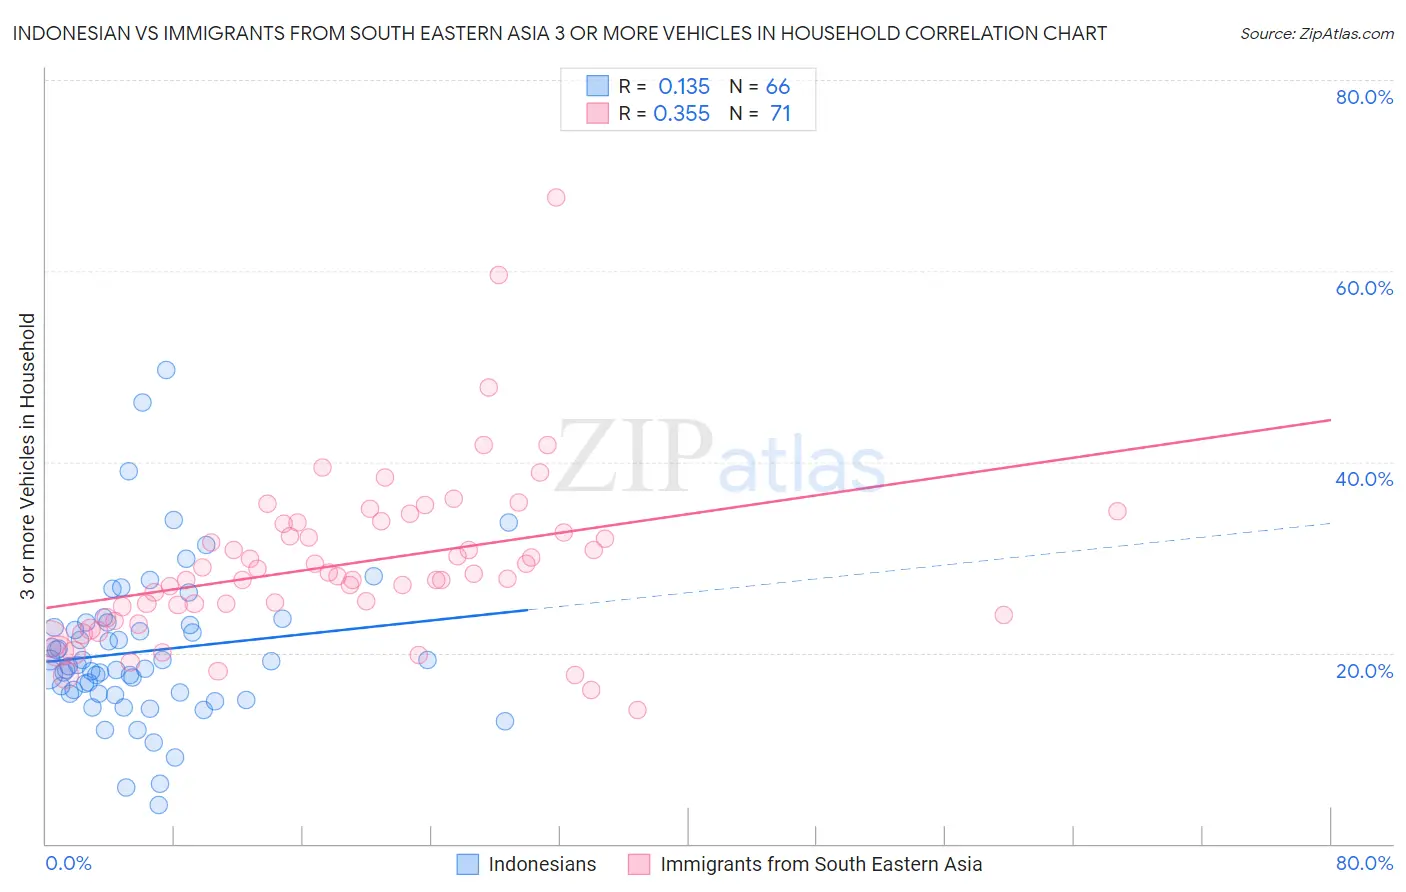
Indonesian vs Immigrants from South Eastern Asia 3 or more Vehicles in Household Correlation Chart
The statistical analysis conducted on geographies consisting of 162,622,478 people shows a poor positive correlation between the proportion of Indonesians and percentage of households with 3 or more vehicles available in the United States with a correlation coefficient (R) of 0.135 and weighted average of 18.3%. Similarly, the statistical analysis conducted on geographies consisting of 512,036,207 people shows a mild positive correlation between the proportion of Immigrants from South Eastern Asia and percentage of households with 3 or more vehicles available in the United States with a correlation coefficient (R) of 0.355 and weighted average of 23.1%, a difference of 26.4%.
3 or more Vehicles in Household Correlation Summary
| Measurement | Indonesian | Immigrants from South Eastern Asia |
| Minimum | 4.1% | 14.1% |
| Maximum | 49.6% | 67.7% |
| Range | 45.5% | 53.6% |
| Mean | 20.2% | 29.3% |
| Median | 18.7% | 28.1% |
| Interquartile 25% (IQ1) | 15.7% | 24.0% |
| Interquartile 75% (IQ3) | 22.9% | 33.5% |
| Interquartile Range (IQR) | 7.2% | 9.5% |
| Standard Deviation (Sample) | 8.1% | 8.8% |
| Standard Deviation (Population) | 8.0% | 8.8% |
Similar Demographics by 3 or more Vehicles in Household
Demographics Similar to Indonesians by 3 or more Vehicles in Household
In terms of 3 or more vehicles in household, the demographic groups most similar to Indonesians are Immigrants from Malaysia (18.3%, a difference of 0.040%), Sierra Leonean (18.3%, a difference of 0.23%), Immigrants from Honduras (18.2%, a difference of 0.23%), Immigrants from Middle Africa (18.2%, a difference of 0.24%), and Immigrants from China (18.2%, a difference of 0.36%).
| Demographics | Rating | Rank | 3 or more Vehicles in Household |
| Immigrants | Western Asia | 4.8 /100 | #230 | Tragic 18.4% |
| Immigrants | Belgium | 4.8 /100 | #231 | Tragic 18.4% |
| Immigrants | Uganda | 4.6 /100 | #232 | Tragic 18.4% |
| Hondurans | 4.6 /100 | #233 | Tragic 18.4% |
| Immigrants | North Macedonia | 4.4 /100 | #234 | Tragic 18.4% |
| Sierra Leoneans | 3.9 /100 | #235 | Tragic 18.3% |
| Immigrants | Malaysia | 3.6 /100 | #236 | Tragic 18.3% |
| Indonesians | 3.5 /100 | #237 | Tragic 18.3% |
| Immigrants | Honduras | 3.1 /100 | #238 | Tragic 18.2% |
| Immigrants | Middle Africa | 3.1 /100 | #239 | Tragic 18.2% |
| Immigrants | China | 2.9 /100 | #240 | Tragic 18.2% |
| Africans | 2.7 /100 | #241 | Tragic 18.2% |
| Hopi | 2.5 /100 | #242 | Tragic 18.2% |
| Immigrants | Europe | 2.4 /100 | #243 | Tragic 18.1% |
| Mongolians | 2.3 /100 | #244 | Tragic 18.1% |
Demographics Similar to Immigrants from South Eastern Asia by 3 or more Vehicles in Household
In terms of 3 or more vehicles in household, the demographic groups most similar to Immigrants from South Eastern Asia are Spanish (23.1%, a difference of 0.17%), English (23.1%, a difference of 0.19%), Lumbee (23.1%, a difference of 0.24%), Pueblo (23.0%, a difference of 0.28%), and Spanish American (23.0%, a difference of 0.34%).
| Demographics | Rating | Rank | 3 or more Vehicles in Household |
| Scandinavians | 100.0 /100 | #23 | Exceptional 23.6% |
| Sri Lankans | 100.0 /100 | #24 | Exceptional 23.6% |
| Immigrants | Central America | 100.0 /100 | #25 | Exceptional 23.4% |
| Mexican American Indians | 100.0 /100 | #26 | Exceptional 23.3% |
| Guamanians/Chamorros | 100.0 /100 | #27 | Exceptional 23.2% |
| Lumbee | 100.0 /100 | #28 | Exceptional 23.1% |
| Spanish | 100.0 /100 | #29 | Exceptional 23.1% |
| Immigrants | South Eastern Asia | 100.0 /100 | #30 | Exceptional 23.1% |
| English | 100.0 /100 | #31 | Exceptional 23.1% |
| Pueblo | 100.0 /100 | #32 | Exceptional 23.0% |
| Spanish Americans | 100.0 /100 | #33 | Exceptional 23.0% |
| Swiss | 100.0 /100 | #34 | Exceptional 23.0% |
| Choctaw | 100.0 /100 | #35 | Exceptional 23.0% |
| Cherokee | 100.0 /100 | #36 | Exceptional 23.0% |
| Swedes | 100.0 /100 | #37 | Exceptional 23.0% |