Immigrants from Afghanistan vs Blackfeet 2 or more Vehicles in Household
COMPARE
Immigrants from Afghanistan
Blackfeet
2 or more Vehicles in Household
2 or more Vehicles in Household Comparison
Immigrants from Afghanistan
Blackfeet
58.3%
2 OR MORE VEHICLES IN HOUSEHOLD
99.6/ 100
METRIC RATING
74th/ 347
METRIC RANK
56.4%
2 OR MORE VEHICLES IN HOUSEHOLD
86.5/ 100
METRIC RATING
135th/ 347
METRIC RANK
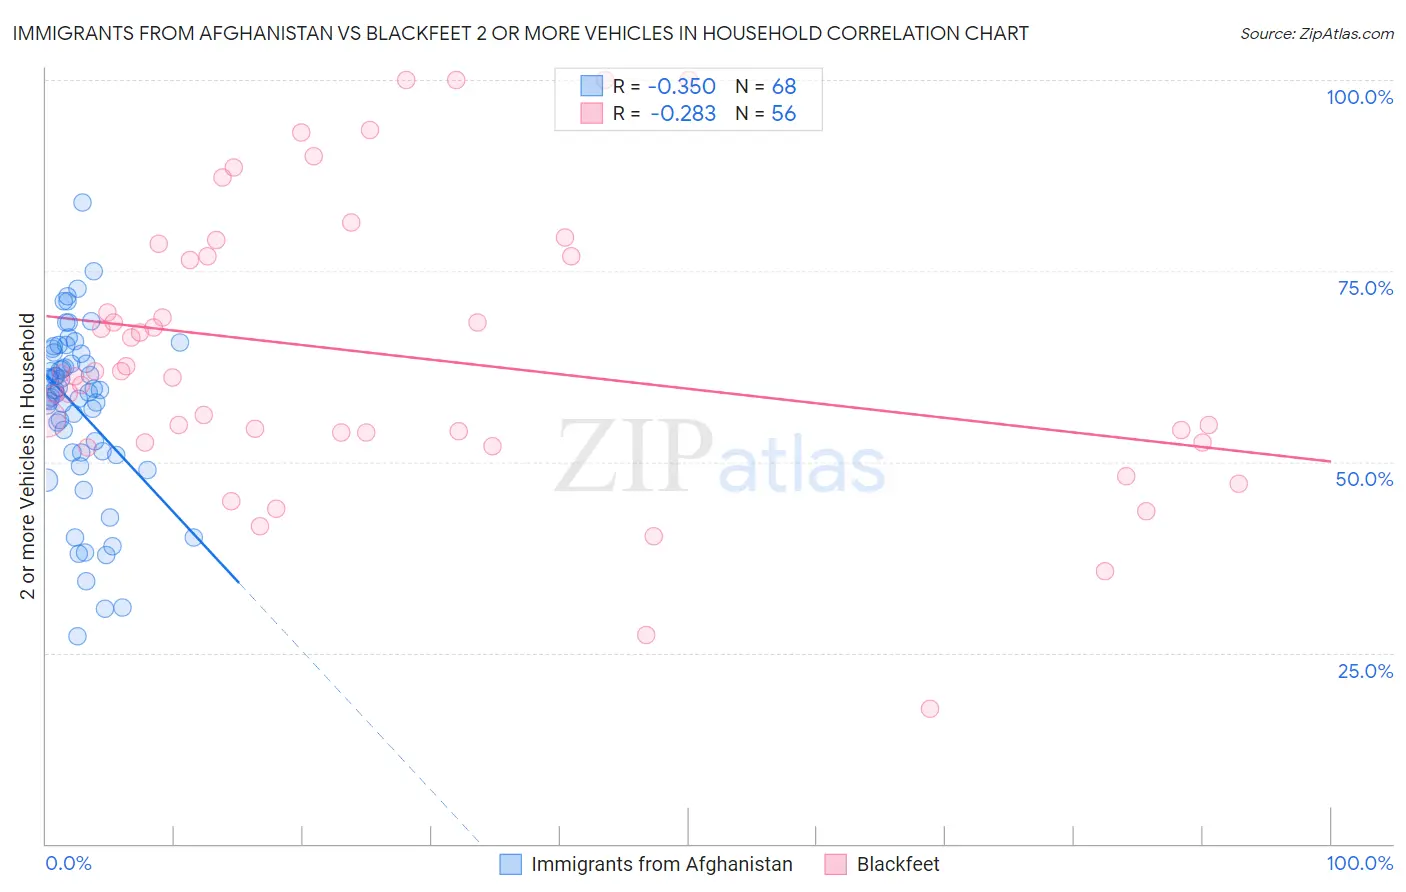
Immigrants from Afghanistan vs Blackfeet 2 or more Vehicles in Household Correlation Chart
The statistical analysis conducted on geographies consisting of 147,637,495 people shows a mild negative correlation between the proportion of Immigrants from Afghanistan and percentage of households with 2 or more vehicles available in the United States with a correlation coefficient (R) of -0.350 and weighted average of 58.3%. Similarly, the statistical analysis conducted on geographies consisting of 309,483,449 people shows a weak negative correlation between the proportion of Blackfeet and percentage of households with 2 or more vehicles available in the United States with a correlation coefficient (R) of -0.283 and weighted average of 56.4%, a difference of 3.5%.
2 or more Vehicles in Household Correlation Summary
| Measurement | Immigrants from Afghanistan | Blackfeet |
| Minimum | 27.1% | 17.6% |
| Maximum | 83.9% | 100.0% |
| Range | 56.8% | 82.4% |
| Mean | 56.9% | 64.0% |
| Median | 59.2% | 61.3% |
| Interquartile 25% (IQ1) | 51.2% | 53.2% |
| Interquartile 75% (IQ3) | 64.3% | 76.8% |
| Interquartile Range (IQR) | 13.0% | 23.7% |
| Standard Deviation (Sample) | 11.4% | 18.5% |
| Standard Deviation (Population) | 11.3% | 18.3% |
Similar Demographics by 2 or more Vehicles in Household
Demographics Similar to Immigrants from Afghanistan by 2 or more Vehicles in Household
In terms of 2 or more vehicles in household, the demographic groups most similar to Immigrants from Afghanistan are Bolivian (58.3%, a difference of 0.0%), Polish (58.3%, a difference of 0.080%), Creek (58.3%, a difference of 0.11%), Slovene (58.3%, a difference of 0.12%), and Austrian (58.4%, a difference of 0.13%).
| Demographics | Rating | Rank | 2 or more Vehicles in Household |
| Laotians | 99.7 /100 | #67 | Exceptional 58.6% |
| Canadians | 99.7 /100 | #68 | Exceptional 58.6% |
| Pennsylvania Germans | 99.7 /100 | #69 | Exceptional 58.5% |
| Italians | 99.6 /100 | #70 | Exceptional 58.4% |
| Bangladeshis | 99.6 /100 | #71 | Exceptional 58.4% |
| Austrians | 99.6 /100 | #72 | Exceptional 58.4% |
| Bolivians | 99.6 /100 | #73 | Exceptional 58.3% |
| Immigrants | Afghanistan | 99.6 /100 | #74 | Exceptional 58.3% |
| Poles | 99.5 /100 | #75 | Exceptional 58.3% |
| Creek | 99.5 /100 | #76 | Exceptional 58.3% |
| Slovenes | 99.5 /100 | #77 | Exceptional 58.3% |
| Lithuanians | 99.5 /100 | #78 | Exceptional 58.2% |
| Delaware | 99.4 /100 | #79 | Exceptional 58.2% |
| Immigrants | England | 99.3 /100 | #80 | Exceptional 58.1% |
| Immigrants | Iraq | 99.3 /100 | #81 | Exceptional 58.1% |
Demographics Similar to Blackfeet by 2 or more Vehicles in Household
In terms of 2 or more vehicles in household, the demographic groups most similar to Blackfeet are Immigrants from the Azores (56.4%, a difference of 0.010%), Immigrants from Asia (56.3%, a difference of 0.040%), Cuban (56.3%, a difference of 0.13%), Salvadoran (56.3%, a difference of 0.14%), and Comanche (56.5%, a difference of 0.16%).
| Demographics | Rating | Rank | 2 or more Vehicles in Household |
| Immigrants | South Central Asia | 90.5 /100 | #128 | Exceptional 56.6% |
| Ute | 90.4 /100 | #129 | Exceptional 56.6% |
| Yugoslavians | 90.0 /100 | #130 | Exceptional 56.6% |
| Bulgarians | 89.7 /100 | #131 | Excellent 56.5% |
| Hungarians | 89.1 /100 | #132 | Excellent 56.5% |
| Comanche | 88.4 /100 | #133 | Excellent 56.5% |
| Immigrants | Azores | 86.6 /100 | #134 | Excellent 56.4% |
| Blackfeet | 86.5 /100 | #135 | Excellent 56.4% |
| Immigrants | Asia | 86.0 /100 | #136 | Excellent 56.3% |
| Cubans | 84.8 /100 | #137 | Excellent 56.3% |
| Salvadorans | 84.7 /100 | #138 | Excellent 56.3% |
| Armenians | 84.3 /100 | #139 | Excellent 56.3% |
| Latvians | 83.6 /100 | #140 | Excellent 56.2% |
| Immigrants | Cambodia | 83.6 /100 | #141 | Excellent 56.2% |
| South Africans | 83.1 /100 | #142 | Excellent 56.2% |