Arab vs Blackfeet 2 or more Vehicles in Household
COMPARE
Arab
Blackfeet
2 or more Vehicles in Household
2 or more Vehicles in Household Comparison
Arabs
Blackfeet
55.0%
2 OR MORE VEHICLES IN HOUSEHOLD
35.9/ 100
METRIC RATING
185th/ 347
METRIC RANK
56.4%
2 OR MORE VEHICLES IN HOUSEHOLD
86.5/ 100
METRIC RATING
135th/ 347
METRIC RANK
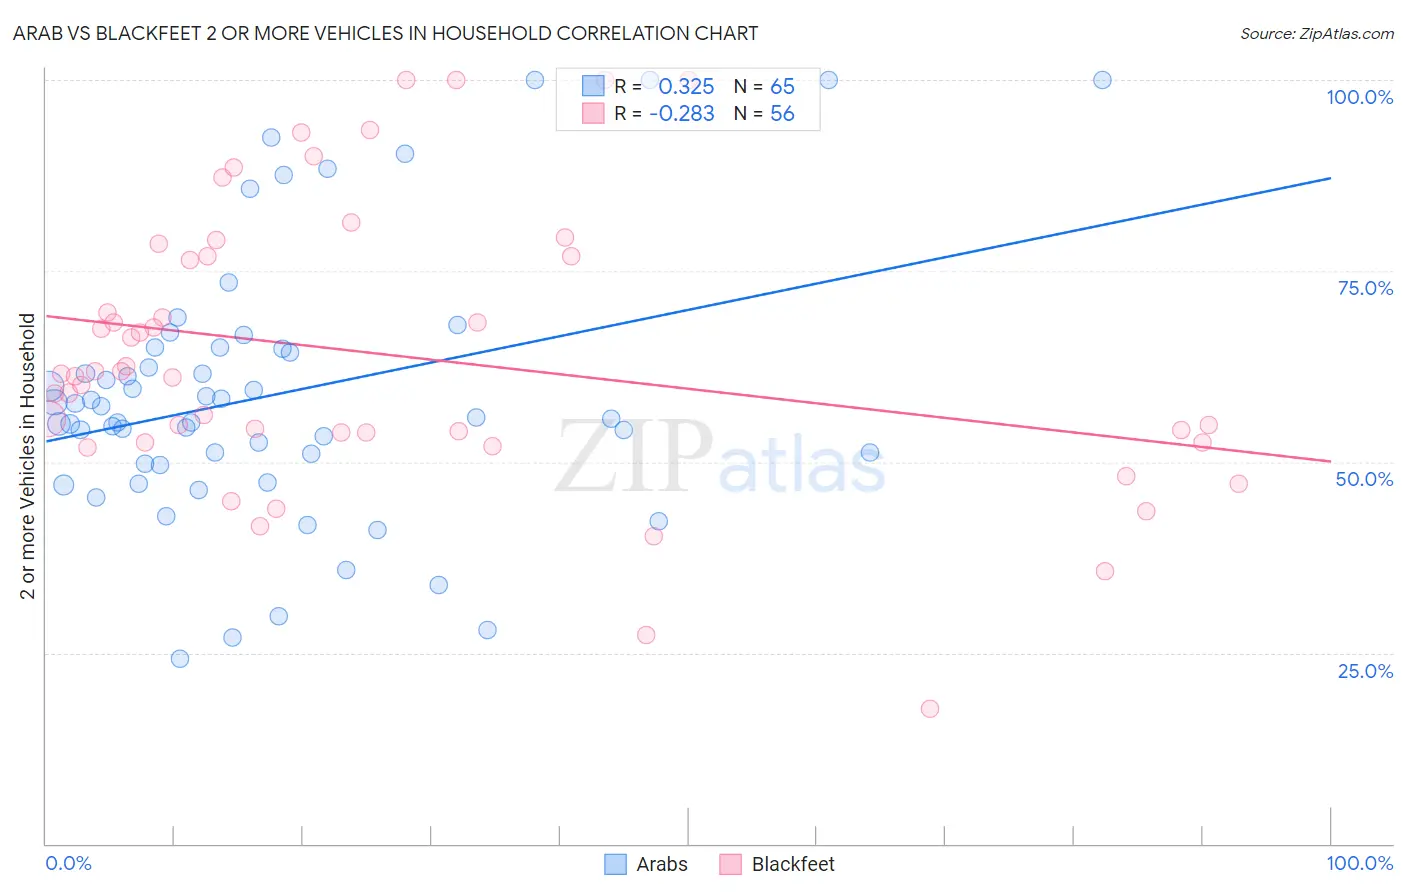
Arab vs Blackfeet 2 or more Vehicles in Household Correlation Chart
The statistical analysis conducted on geographies consisting of 486,450,180 people shows a mild positive correlation between the proportion of Arabs and percentage of households with 2 or more vehicles available in the United States with a correlation coefficient (R) of 0.325 and weighted average of 55.0%. Similarly, the statistical analysis conducted on geographies consisting of 309,483,449 people shows a weak negative correlation between the proportion of Blackfeet and percentage of households with 2 or more vehicles available in the United States with a correlation coefficient (R) of -0.283 and weighted average of 56.4%, a difference of 2.4%.
2 or more Vehicles in Household Correlation Summary
| Measurement | Arab | Blackfeet |
| Minimum | 24.3% | 17.6% |
| Maximum | 100.0% | 100.0% |
| Range | 75.7% | 82.4% |
| Mean | 58.8% | 64.0% |
| Median | 55.8% | 61.3% |
| Interquartile 25% (IQ1) | 49.7% | 53.2% |
| Interquartile 75% (IQ3) | 64.9% | 76.8% |
| Interquartile Range (IQR) | 15.2% | 23.7% |
| Standard Deviation (Sample) | 17.5% | 18.5% |
| Standard Deviation (Population) | 17.4% | 18.3% |
Similar Demographics by 2 or more Vehicles in Household
Demographics Similar to Arabs by 2 or more Vehicles in Household
In terms of 2 or more vehicles in household, the demographic groups most similar to Arabs are Apache (55.1%, a difference of 0.030%), Immigrants from Cameroon (55.1%, a difference of 0.060%), Immigrants from Micronesia (55.1%, a difference of 0.10%), Cree (55.1%, a difference of 0.10%), and Peruvian (55.0%, a difference of 0.10%).
| Demographics | Rating | Rank | 2 or more Vehicles in Household |
| Immigrants | Sweden | 45.3 /100 | #178 | Average 55.2% |
| Alaskan Athabascans | 42.9 /100 | #179 | Average 55.2% |
| Immigrants | Kenya | 40.4 /100 | #180 | Average 55.1% |
| Immigrants | Micronesia | 38.2 /100 | #181 | Fair 55.1% |
| Cree | 38.2 /100 | #182 | Fair 55.1% |
| Immigrants | Cameroon | 37.3 /100 | #183 | Fair 55.1% |
| Apache | 36.7 /100 | #184 | Fair 55.1% |
| Arabs | 35.9 /100 | #185 | Fair 55.0% |
| Peruvians | 33.7 /100 | #186 | Fair 55.0% |
| Immigrants | Uganda | 33.4 /100 | #187 | Fair 55.0% |
| Marshallese | 30.5 /100 | #188 | Fair 54.9% |
| Eastern Europeans | 27.5 /100 | #189 | Fair 54.8% |
| Russians | 26.3 /100 | #190 | Fair 54.8% |
| Immigrants | Immigrants | 25.0 /100 | #191 | Fair 54.7% |
| Immigrants | Romania | 23.8 /100 | #192 | Fair 54.7% |
Demographics Similar to Blackfeet by 2 or more Vehicles in Household
In terms of 2 or more vehicles in household, the demographic groups most similar to Blackfeet are Immigrants from the Azores (56.4%, a difference of 0.010%), Immigrants from Asia (56.3%, a difference of 0.040%), Cuban (56.3%, a difference of 0.13%), Salvadoran (56.3%, a difference of 0.14%), and Comanche (56.5%, a difference of 0.16%).
| Demographics | Rating | Rank | 2 or more Vehicles in Household |
| Immigrants | South Central Asia | 90.5 /100 | #128 | Exceptional 56.6% |
| Ute | 90.4 /100 | #129 | Exceptional 56.6% |
| Yugoslavians | 90.0 /100 | #130 | Exceptional 56.6% |
| Bulgarians | 89.7 /100 | #131 | Excellent 56.5% |
| Hungarians | 89.1 /100 | #132 | Excellent 56.5% |
| Comanche | 88.4 /100 | #133 | Excellent 56.5% |
| Immigrants | Azores | 86.6 /100 | #134 | Excellent 56.4% |
| Blackfeet | 86.5 /100 | #135 | Excellent 56.4% |
| Immigrants | Asia | 86.0 /100 | #136 | Excellent 56.3% |
| Cubans | 84.8 /100 | #137 | Excellent 56.3% |
| Salvadorans | 84.7 /100 | #138 | Excellent 56.3% |
| Armenians | 84.3 /100 | #139 | Excellent 56.3% |
| Latvians | 83.6 /100 | #140 | Excellent 56.2% |
| Immigrants | Cambodia | 83.6 /100 | #141 | Excellent 56.2% |
| South Africans | 83.1 /100 | #142 | Excellent 56.2% |