Immigrants from Singapore vs Immigrants from Zimbabwe 4 or more Vehicles in Household
COMPARE
Immigrants from Singapore
Immigrants from Zimbabwe
4 or more Vehicles in Household
4 or more Vehicles in Household Comparison
Immigrants from Singapore
Immigrants from Zimbabwe
5.9%
4 OR MORE VEHICLES IN HOUSEHOLD
7.9/ 100
METRIC RATING
226th/ 347
METRIC RANK
6.0%
4 OR MORE VEHICLES IN HOUSEHOLD
15.1/ 100
METRIC RATING
210th/ 347
METRIC RANK
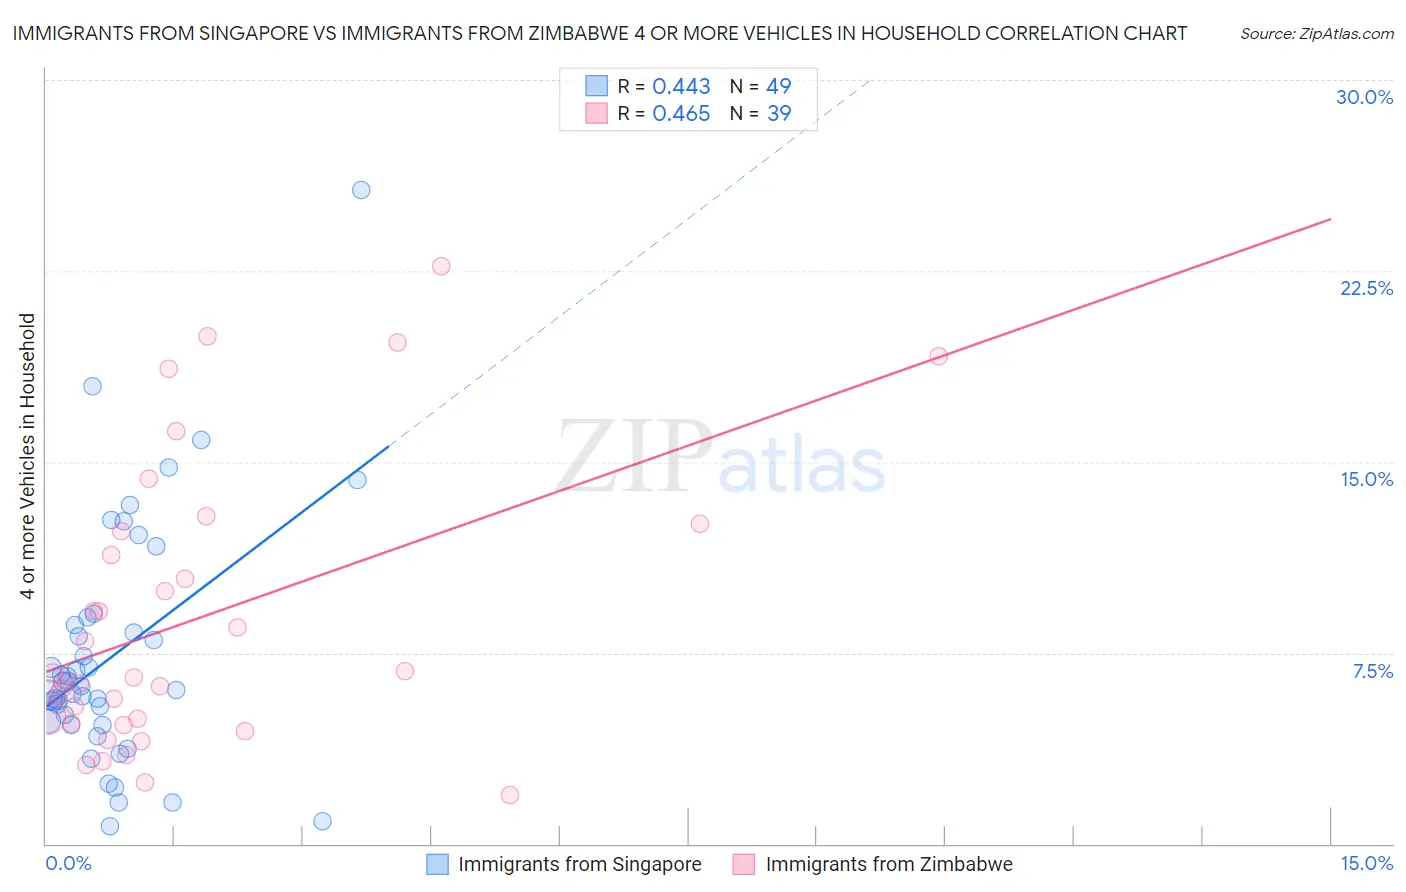
Immigrants from Singapore vs Immigrants from Zimbabwe 4 or more Vehicles in Household Correlation Chart
The statistical analysis conducted on geographies consisting of 136,732,831 people shows a moderate positive correlation between the proportion of Immigrants from Singapore and percentage of households with 4 or more vehicles available in the United States with a correlation coefficient (R) of 0.443 and weighted average of 5.9%. Similarly, the statistical analysis conducted on geographies consisting of 117,555,035 people shows a moderate positive correlation between the proportion of Immigrants from Zimbabwe and percentage of households with 4 or more vehicles available in the United States with a correlation coefficient (R) of 0.465 and weighted average of 6.0%, a difference of 2.0%.
4 or more Vehicles in Household Correlation Summary
| Measurement | Immigrants from Singapore | Immigrants from Zimbabwe |
| Minimum | 0.67% | 1.9% |
| Maximum | 25.7% | 22.7% |
| Range | 25.0% | 20.7% |
| Mean | 7.4% | 8.8% |
| Median | 6.2% | 6.5% |
| Interquartile 25% (IQ1) | 4.7% | 4.7% |
| Interquartile 75% (IQ3) | 8.7% | 12.3% |
| Interquartile Range (IQR) | 4.0% | 7.6% |
| Standard Deviation (Sample) | 4.7% | 5.5% |
| Standard Deviation (Population) | 4.7% | 5.4% |
Demographics Similar to Immigrants from Singapore and Immigrants from Zimbabwe by 4 or more Vehicles in Household
In terms of 4 or more vehicles in household, the demographic groups most similar to Immigrants from Singapore are Immigrants from Western Asia (5.9%, a difference of 0.040%), Immigrants from Uganda (5.9%, a difference of 0.13%), Indonesian (6.0%, a difference of 0.38%), Cuban (6.0%, a difference of 0.46%), and Cajun (6.0%, a difference of 0.47%). Similarly, the demographic groups most similar to Immigrants from Zimbabwe are Immigrants from Honduras (6.1%, a difference of 0.050%), Panamanian (6.0%, a difference of 0.080%), Immigrants from Nigeria (6.1%, a difference of 0.090%), Immigrants from Egypt (6.0%, a difference of 0.10%), and Arab (6.0%, a difference of 0.15%).
| Demographics | Rating | Rank | 4 or more Vehicles in Household |
| Immigrants | Nigeria | 15.6 /100 | #208 | Poor 6.1% |
| Immigrants | Honduras | 15.4 /100 | #209 | Poor 6.1% |
| Immigrants | Zimbabwe | 15.1 /100 | #210 | Poor 6.0% |
| Panamanians | 14.8 /100 | #211 | Poor 6.0% |
| Immigrants | Egypt | 14.7 /100 | #212 | Poor 6.0% |
| Arabs | 14.4 /100 | #213 | Poor 6.0% |
| Immigrants | Austria | 14.3 /100 | #214 | Poor 6.0% |
| Immigrants | China | 13.8 /100 | #215 | Poor 6.0% |
| Immigrants | Romania | 13.8 /100 | #216 | Poor 6.0% |
| Nigerians | 12.2 /100 | #217 | Poor 6.0% |
| Immigrants | Italy | 11.0 /100 | #218 | Poor 6.0% |
| Serbians | 11.0 /100 | #219 | Poor 6.0% |
| Russians | 10.3 /100 | #220 | Poor 6.0% |
| Immigrants | Moldova | 9.3 /100 | #221 | Tragic 6.0% |
| Cajuns | 9.2 /100 | #222 | Tragic 6.0% |
| Immigrants | Kenya | 9.2 /100 | #223 | Tragic 6.0% |
| Cubans | 9.2 /100 | #224 | Tragic 6.0% |
| Indonesians | 8.9 /100 | #225 | Tragic 6.0% |
| Immigrants | Singapore | 7.9 /100 | #226 | Tragic 5.9% |
| Immigrants | Western Asia | 7.8 /100 | #227 | Tragic 5.9% |
| Immigrants | Uganda | 7.5 /100 | #228 | Tragic 5.9% |