Immigrants from Belarus vs Immigrants from Zimbabwe 4 or more Vehicles in Household
COMPARE
Immigrants from Belarus
Immigrants from Zimbabwe
4 or more Vehicles in Household
4 or more Vehicles in Household Comparison
Immigrants from Belarus
Immigrants from Zimbabwe
4.7%
4 OR MORE VEHICLES IN HOUSEHOLD
0.0/ 100
METRIC RATING
315th/ 347
METRIC RANK
6.0%
4 OR MORE VEHICLES IN HOUSEHOLD
15.1/ 100
METRIC RATING
210th/ 347
METRIC RANK
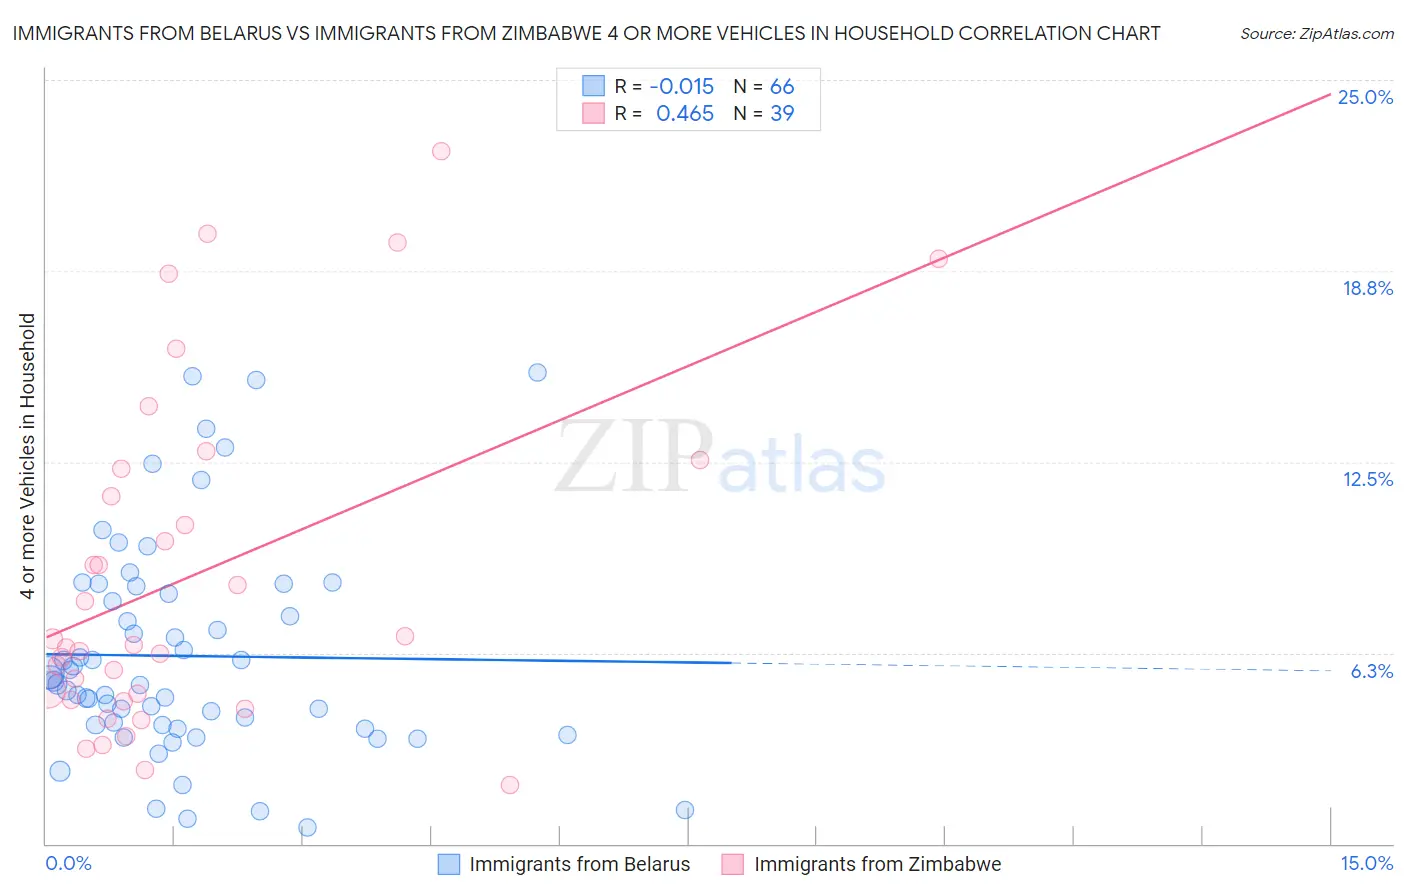
Immigrants from Belarus vs Immigrants from Zimbabwe 4 or more Vehicles in Household Correlation Chart
The statistical analysis conducted on geographies consisting of 149,564,029 people shows no correlation between the proportion of Immigrants from Belarus and percentage of households with 4 or more vehicles available in the United States with a correlation coefficient (R) of -0.015 and weighted average of 4.7%. Similarly, the statistical analysis conducted on geographies consisting of 117,555,035 people shows a moderate positive correlation between the proportion of Immigrants from Zimbabwe and percentage of households with 4 or more vehicles available in the United States with a correlation coefficient (R) of 0.465 and weighted average of 6.0%, a difference of 27.6%.
4 or more Vehicles in Household Correlation Summary
| Measurement | Immigrants from Belarus | Immigrants from Zimbabwe |
| Minimum | 0.52% | 1.9% |
| Maximum | 15.4% | 22.7% |
| Range | 14.9% | 20.7% |
| Mean | 6.1% | 8.8% |
| Median | 5.3% | 6.5% |
| Interquartile 25% (IQ1) | 3.9% | 4.7% |
| Interquartile 75% (IQ3) | 8.2% | 12.3% |
| Interquartile Range (IQR) | 4.3% | 7.6% |
| Standard Deviation (Sample) | 3.5% | 5.5% |
| Standard Deviation (Population) | 3.5% | 5.4% |
Similar Demographics by 4 or more Vehicles in Household
Demographics Similar to Immigrants from Belarus by 4 or more Vehicles in Household
In terms of 4 or more vehicles in household, the demographic groups most similar to Immigrants from Belarus are Immigrants from West Indies (4.7%, a difference of 0.090%), Puerto Rican (4.7%, a difference of 0.44%), Immigrants from Israel (4.8%, a difference of 0.88%), Albanian (4.8%, a difference of 0.90%), and U.S. Virgin Islander (4.6%, a difference of 2.1%).
| Demographics | Rating | Rank | 4 or more Vehicles in Household |
| Paraguayans | 0.0 /100 | #308 | Tragic 4.9% |
| Immigrants | Somalia | 0.0 /100 | #309 | Tragic 4.9% |
| Moroccans | 0.0 /100 | #310 | Tragic 4.9% |
| Houma | 0.0 /100 | #311 | Tragic 4.9% |
| Albanians | 0.0 /100 | #312 | Tragic 4.8% |
| Immigrants | Israel | 0.0 /100 | #313 | Tragic 4.8% |
| Immigrants | West Indies | 0.0 /100 | #314 | Tragic 4.7% |
| Immigrants | Belarus | 0.0 /100 | #315 | Tragic 4.7% |
| Puerto Ricans | 0.0 /100 | #316 | Tragic 4.7% |
| U.S. Virgin Islanders | 0.0 /100 | #317 | Tragic 4.6% |
| Jamaicans | 0.0 /100 | #318 | Tragic 4.6% |
| Haitians | 0.0 /100 | #319 | Tragic 4.6% |
| Immigrants | Haiti | 0.0 /100 | #320 | Tragic 4.5% |
| Ecuadorians | 0.0 /100 | #321 | Tragic 4.5% |
| Immigrants | Yemen | 0.0 /100 | #322 | Tragic 4.5% |
Demographics Similar to Immigrants from Zimbabwe by 4 or more Vehicles in Household
In terms of 4 or more vehicles in household, the demographic groups most similar to Immigrants from Zimbabwe are Immigrants from Honduras (6.1%, a difference of 0.050%), Panamanian (6.0%, a difference of 0.080%), Immigrants from Nigeria (6.1%, a difference of 0.090%), Immigrants from Egypt (6.0%, a difference of 0.10%), and Arab (6.0%, a difference of 0.15%).
| Demographics | Rating | Rank | 4 or more Vehicles in Household |
| Immigrants | Sierra Leone | 20.5 /100 | #203 | Fair 6.1% |
| Immigrants | Belize | 19.8 /100 | #204 | Poor 6.1% |
| Hondurans | 19.3 /100 | #205 | Poor 6.1% |
| Kenyans | 18.5 /100 | #206 | Poor 6.1% |
| Immigrants | Chile | 16.9 /100 | #207 | Poor 6.1% |
| Immigrants | Nigeria | 15.6 /100 | #208 | Poor 6.1% |
| Immigrants | Honduras | 15.4 /100 | #209 | Poor 6.1% |
| Immigrants | Zimbabwe | 15.1 /100 | #210 | Poor 6.0% |
| Panamanians | 14.8 /100 | #211 | Poor 6.0% |
| Immigrants | Egypt | 14.7 /100 | #212 | Poor 6.0% |
| Arabs | 14.4 /100 | #213 | Poor 6.0% |
| Immigrants | Austria | 14.3 /100 | #214 | Poor 6.0% |
| Immigrants | China | 13.8 /100 | #215 | Poor 6.0% |
| Immigrants | Romania | 13.8 /100 | #216 | Poor 6.0% |
| Nigerians | 12.2 /100 | #217 | Poor 6.0% |