Puerto Rican vs Immigrants from Zimbabwe 4 or more Vehicles in Household
COMPARE
Puerto Rican
Immigrants from Zimbabwe
4 or more Vehicles in Household
4 or more Vehicles in Household Comparison
Puerto Ricans
Immigrants from Zimbabwe
4.7%
4 OR MORE VEHICLES IN HOUSEHOLD
0.0/ 100
METRIC RATING
316th/ 347
METRIC RANK
6.0%
4 OR MORE VEHICLES IN HOUSEHOLD
15.1/ 100
METRIC RATING
210th/ 347
METRIC RANK
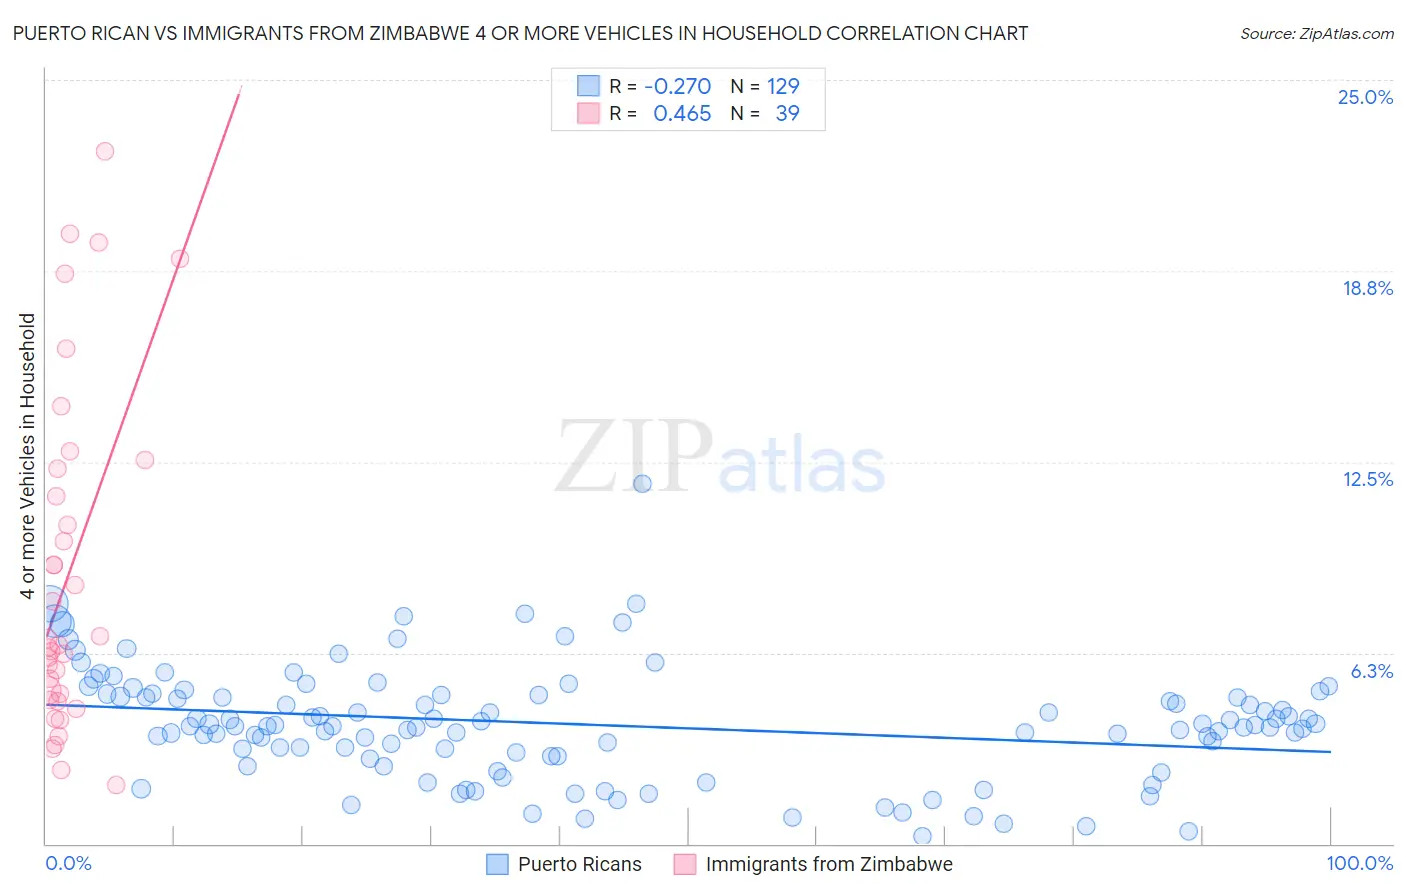
Puerto Rican vs Immigrants from Zimbabwe 4 or more Vehicles in Household Correlation Chart
The statistical analysis conducted on geographies consisting of 525,186,589 people shows a weak negative correlation between the proportion of Puerto Ricans and percentage of households with 4 or more vehicles available in the United States with a correlation coefficient (R) of -0.270 and weighted average of 4.7%. Similarly, the statistical analysis conducted on geographies consisting of 117,555,035 people shows a moderate positive correlation between the proportion of Immigrants from Zimbabwe and percentage of households with 4 or more vehicles available in the United States with a correlation coefficient (R) of 0.465 and weighted average of 6.0%, a difference of 28.1%.
4 or more Vehicles in Household Correlation Summary
| Measurement | Puerto Rican | Immigrants from Zimbabwe |
| Minimum | 0.24% | 1.9% |
| Maximum | 11.8% | 22.7% |
| Range | 11.5% | 20.7% |
| Mean | 3.9% | 8.8% |
| Median | 3.8% | 6.5% |
| Interquartile 25% (IQ1) | 2.9% | 4.7% |
| Interquartile 75% (IQ3) | 4.9% | 12.3% |
| Interquartile Range (IQR) | 2.0% | 7.6% |
| Standard Deviation (Sample) | 1.8% | 5.5% |
| Standard Deviation (Population) | 1.8% | 5.4% |
Similar Demographics by 4 or more Vehicles in Household
Demographics Similar to Puerto Ricans by 4 or more Vehicles in Household
In terms of 4 or more vehicles in household, the demographic groups most similar to Puerto Ricans are Immigrants from Belarus (4.7%, a difference of 0.44%), Immigrants from West Indies (4.7%, a difference of 0.53%), Immigrants from Israel (4.8%, a difference of 1.3%), Albanian (4.8%, a difference of 1.3%), and U.S. Virgin Islander (4.6%, a difference of 1.7%).
| Demographics | Rating | Rank | 4 or more Vehicles in Household |
| Immigrants | Somalia | 0.0 /100 | #309 | Tragic 4.9% |
| Moroccans | 0.0 /100 | #310 | Tragic 4.9% |
| Houma | 0.0 /100 | #311 | Tragic 4.9% |
| Albanians | 0.0 /100 | #312 | Tragic 4.8% |
| Immigrants | Israel | 0.0 /100 | #313 | Tragic 4.8% |
| Immigrants | West Indies | 0.0 /100 | #314 | Tragic 4.7% |
| Immigrants | Belarus | 0.0 /100 | #315 | Tragic 4.7% |
| Puerto Ricans | 0.0 /100 | #316 | Tragic 4.7% |
| U.S. Virgin Islanders | 0.0 /100 | #317 | Tragic 4.6% |
| Jamaicans | 0.0 /100 | #318 | Tragic 4.6% |
| Haitians | 0.0 /100 | #319 | Tragic 4.6% |
| Immigrants | Haiti | 0.0 /100 | #320 | Tragic 4.5% |
| Ecuadorians | 0.0 /100 | #321 | Tragic 4.5% |
| Immigrants | Yemen | 0.0 /100 | #322 | Tragic 4.5% |
| Immigrants | Caribbean | 0.0 /100 | #323 | Tragic 4.4% |
Demographics Similar to Immigrants from Zimbabwe by 4 or more Vehicles in Household
In terms of 4 or more vehicles in household, the demographic groups most similar to Immigrants from Zimbabwe are Immigrants from Honduras (6.1%, a difference of 0.050%), Panamanian (6.0%, a difference of 0.080%), Immigrants from Nigeria (6.1%, a difference of 0.090%), Immigrants from Egypt (6.0%, a difference of 0.10%), and Arab (6.0%, a difference of 0.15%).
| Demographics | Rating | Rank | 4 or more Vehicles in Household |
| Immigrants | Sierra Leone | 20.5 /100 | #203 | Fair 6.1% |
| Immigrants | Belize | 19.8 /100 | #204 | Poor 6.1% |
| Hondurans | 19.3 /100 | #205 | Poor 6.1% |
| Kenyans | 18.5 /100 | #206 | Poor 6.1% |
| Immigrants | Chile | 16.9 /100 | #207 | Poor 6.1% |
| Immigrants | Nigeria | 15.6 /100 | #208 | Poor 6.1% |
| Immigrants | Honduras | 15.4 /100 | #209 | Poor 6.1% |
| Immigrants | Zimbabwe | 15.1 /100 | #210 | Poor 6.0% |
| Panamanians | 14.8 /100 | #211 | Poor 6.0% |
| Immigrants | Egypt | 14.7 /100 | #212 | Poor 6.0% |
| Arabs | 14.4 /100 | #213 | Poor 6.0% |
| Immigrants | Austria | 14.3 /100 | #214 | Poor 6.0% |
| Immigrants | China | 13.8 /100 | #215 | Poor 6.0% |
| Immigrants | Romania | 13.8 /100 | #216 | Poor 6.0% |
| Nigerians | 12.2 /100 | #217 | Poor 6.0% |