Serbian vs Immigrants from Australia 4 or more Vehicles in Household
COMPARE
Serbian
Immigrants from Australia
4 or more Vehicles in Household
4 or more Vehicles in Household Comparison
Serbians
Immigrants from Australia
6.0%
4 OR MORE VEHICLES IN HOUSEHOLD
11.0/ 100
METRIC RATING
219th/ 347
METRIC RANK
5.8%
4 OR MORE VEHICLES IN HOUSEHOLD
3.8/ 100
METRIC RATING
239th/ 347
METRIC RANK
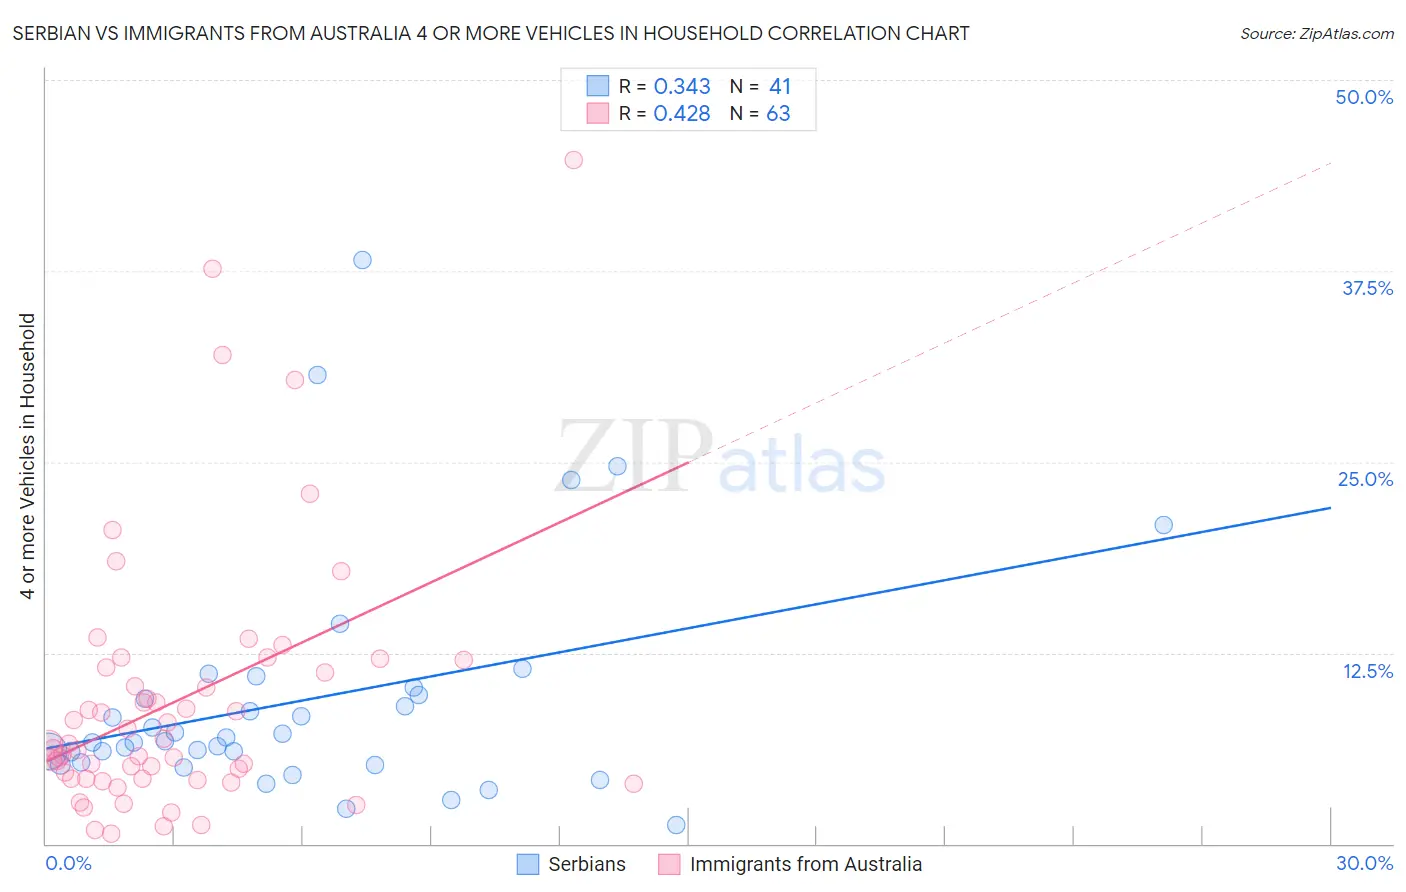
Serbian vs Immigrants from Australia 4 or more Vehicles in Household Correlation Chart
The statistical analysis conducted on geographies consisting of 266,656,513 people shows a mild positive correlation between the proportion of Serbians and percentage of households with 4 or more vehicles available in the United States with a correlation coefficient (R) of 0.343 and weighted average of 6.0%. Similarly, the statistical analysis conducted on geographies consisting of 226,216,978 people shows a moderate positive correlation between the proportion of Immigrants from Australia and percentage of households with 4 or more vehicles available in the United States with a correlation coefficient (R) of 0.428 and weighted average of 5.8%, a difference of 3.1%.
4 or more Vehicles in Household Correlation Summary
| Measurement | Serbian | Immigrants from Australia |
| Minimum | 1.2% | 0.65% |
| Maximum | 38.2% | 44.7% |
| Range | 37.0% | 44.1% |
| Mean | 9.4% | 9.3% |
| Median | 6.7% | 6.5% |
| Interquartile 25% (IQ1) | 5.2% | 4.2% |
| Interquartile 75% (IQ3) | 10.0% | 11.6% |
| Interquartile Range (IQR) | 4.7% | 7.3% |
| Standard Deviation (Sample) | 7.7% | 8.6% |
| Standard Deviation (Population) | 7.6% | 8.5% |
Demographics Similar to Serbians and Immigrants from Australia by 4 or more Vehicles in Household
In terms of 4 or more vehicles in household, the demographic groups most similar to Serbians are Russian (6.0%, a difference of 0.19%), Immigrants from Moldova (6.0%, a difference of 0.49%), Cajun (6.0%, a difference of 0.52%), Immigrants from Kenya (6.0%, a difference of 0.52%), and Cuban (6.0%, a difference of 0.54%). Similarly, the demographic groups most similar to Immigrants from Australia are Immigrants from Belgium (5.8%, a difference of 0.090%), Turkish (5.8%, a difference of 0.22%), Immigrants from Eritrea (5.8%, a difference of 0.49%), Immigrants from Hungary (5.8%, a difference of 0.51%), and African (5.8%, a difference of 0.53%).
| Demographics | Rating | Rank | 4 or more Vehicles in Household |
| Serbians | 11.0 /100 | #219 | Poor 6.0% |
| Russians | 10.3 /100 | #220 | Poor 6.0% |
| Immigrants | Moldova | 9.3 /100 | #221 | Tragic 6.0% |
| Cajuns | 9.2 /100 | #222 | Tragic 6.0% |
| Immigrants | Kenya | 9.2 /100 | #223 | Tragic 6.0% |
| Cubans | 9.2 /100 | #224 | Tragic 6.0% |
| Indonesians | 8.9 /100 | #225 | Tragic 6.0% |
| Immigrants | Singapore | 7.9 /100 | #226 | Tragic 5.9% |
| Immigrants | Western Asia | 7.8 /100 | #227 | Tragic 5.9% |
| Immigrants | Uganda | 7.5 /100 | #228 | Tragic 5.9% |
| Eastern Europeans | 6.8 /100 | #229 | Tragic 5.9% |
| Immigrants | Malaysia | 6.7 /100 | #230 | Tragic 5.9% |
| Immigrants | Switzerland | 6.4 /100 | #231 | Tragic 5.9% |
| Immigrants | Argentina | 6.0 /100 | #232 | Tragic 5.9% |
| Sierra Leoneans | 6.0 /100 | #233 | Tragic 5.9% |
| Africans | 4.6 /100 | #234 | Tragic 5.8% |
| Immigrants | Hungary | 4.6 /100 | #235 | Tragic 5.8% |
| Immigrants | Eritrea | 4.5 /100 | #236 | Tragic 5.8% |
| Turks | 4.1 /100 | #237 | Tragic 5.8% |
| Immigrants | Belgium | 4.0 /100 | #238 | Tragic 5.8% |
| Immigrants | Australia | 3.8 /100 | #239 | Tragic 5.8% |