Ugandan vs Immigrants from Australia 4 or more Vehicles in Household
COMPARE
Ugandan
Immigrants from Australia
4 or more Vehicles in Household
4 or more Vehicles in Household Comparison
Ugandans
Immigrants from Australia
5.7%
4 OR MORE VEHICLES IN HOUSEHOLD
2.2/ 100
METRIC RATING
251st/ 347
METRIC RANK
5.8%
4 OR MORE VEHICLES IN HOUSEHOLD
3.8/ 100
METRIC RATING
239th/ 347
METRIC RANK
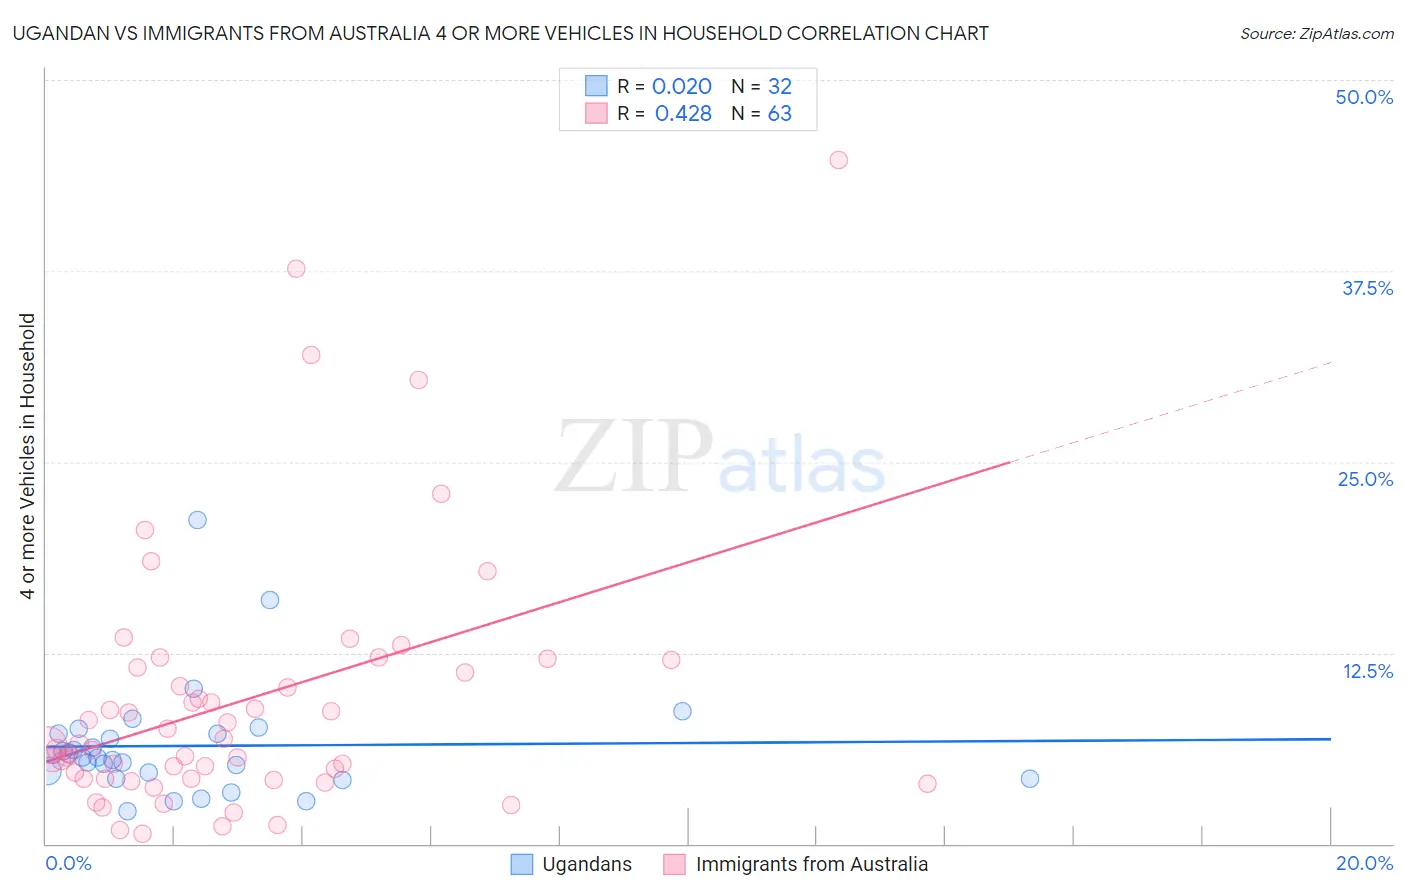
Ugandan vs Immigrants from Australia 4 or more Vehicles in Household Correlation Chart
The statistical analysis conducted on geographies consisting of 93,911,160 people shows no correlation between the proportion of Ugandans and percentage of households with 4 or more vehicles available in the United States with a correlation coefficient (R) of 0.020 and weighted average of 5.7%. Similarly, the statistical analysis conducted on geographies consisting of 226,216,978 people shows a moderate positive correlation between the proportion of Immigrants from Australia and percentage of households with 4 or more vehicles available in the United States with a correlation coefficient (R) of 0.428 and weighted average of 5.8%, a difference of 1.5%.
4 or more Vehicles in Household Correlation Summary
| Measurement | Ugandan | Immigrants from Australia |
| Minimum | 2.2% | 0.65% |
| Maximum | 21.2% | 44.7% |
| Range | 19.1% | 44.1% |
| Mean | 6.4% | 9.3% |
| Median | 5.6% | 6.5% |
| Interquartile 25% (IQ1) | 4.5% | 4.2% |
| Interquartile 75% (IQ3) | 7.2% | 11.6% |
| Interquartile Range (IQR) | 2.7% | 7.3% |
| Standard Deviation (Sample) | 3.7% | 8.6% |
| Standard Deviation (Population) | 3.7% | 8.5% |
Demographics Similar to Ugandans and Immigrants from Australia by 4 or more Vehicles in Household
In terms of 4 or more vehicles in household, the demographic groups most similar to Ugandans are Immigrants from Europe (5.7%, a difference of 0.020%), Immigrants from Southern Europe (5.7%, a difference of 0.12%), Immigrants from Eastern Africa (5.7%, a difference of 0.14%), Subsaharan African (5.7%, a difference of 0.23%), and Immigrants from Ethiopia (5.7%, a difference of 0.25%). Similarly, the demographic groups most similar to Immigrants from Australia are Immigrants from Poland (5.8%, a difference of 0.040%), Immigrants from Belgium (5.8%, a difference of 0.090%), Mongolian (5.8%, a difference of 0.14%), Turkish (5.8%, a difference of 0.22%), and Immigrants from Middle Africa (5.8%, a difference of 0.35%).
| Demographics | Rating | Rank | 4 or more Vehicles in Household |
| Immigrants | Hungary | 4.6 /100 | #235 | Tragic 5.8% |
| Immigrants | Eritrea | 4.5 /100 | #236 | Tragic 5.8% |
| Turks | 4.1 /100 | #237 | Tragic 5.8% |
| Immigrants | Belgium | 4.0 /100 | #238 | Tragic 5.8% |
| Immigrants | Australia | 3.8 /100 | #239 | Tragic 5.8% |
| Immigrants | Poland | 3.8 /100 | #240 | Tragic 5.8% |
| Mongolians | 3.7 /100 | #241 | Tragic 5.8% |
| Immigrants | Middle Africa | 3.4 /100 | #242 | Tragic 5.8% |
| Immigrants | Czechoslovakia | 3.2 /100 | #243 | Tragic 5.8% |
| Ethiopians | 3.2 /100 | #244 | Tragic 5.8% |
| Bulgarians | 3.1 /100 | #245 | Tragic 5.8% |
| Immigrants | North Macedonia | 2.5 /100 | #246 | Tragic 5.7% |
| Immigrants | Ethiopia | 2.4 /100 | #247 | Tragic 5.7% |
| Immigrants | Eastern Africa | 2.4 /100 | #248 | Tragic 5.7% |
| Immigrants | Southern Europe | 2.3 /100 | #249 | Tragic 5.7% |
| Immigrants | Europe | 2.3 /100 | #250 | Tragic 5.7% |
| Ugandans | 2.2 /100 | #251 | Tragic 5.7% |
| Sub-Saharan Africans | 2.1 /100 | #252 | Tragic 5.7% |
| Immigrants | Cuba | 1.6 /100 | #253 | Tragic 5.7% |
| Immigrants | Panama | 1.5 /100 | #254 | Tragic 5.7% |
| Yup'ik | 1.5 /100 | #255 | Tragic 5.7% |