Immigrants from Eastern Europe vs Immigrants from Australia 4 or more Vehicles in Household
COMPARE
Immigrants from Eastern Europe
Immigrants from Australia
4 or more Vehicles in Household
4 or more Vehicles in Household Comparison
Immigrants from Eastern Europe
Immigrants from Australia
5.4%
4 OR MORE VEHICLES IN HOUSEHOLD
0.4/ 100
METRIC RATING
278th/ 347
METRIC RANK
5.8%
4 OR MORE VEHICLES IN HOUSEHOLD
3.8/ 100
METRIC RATING
239th/ 347
METRIC RANK
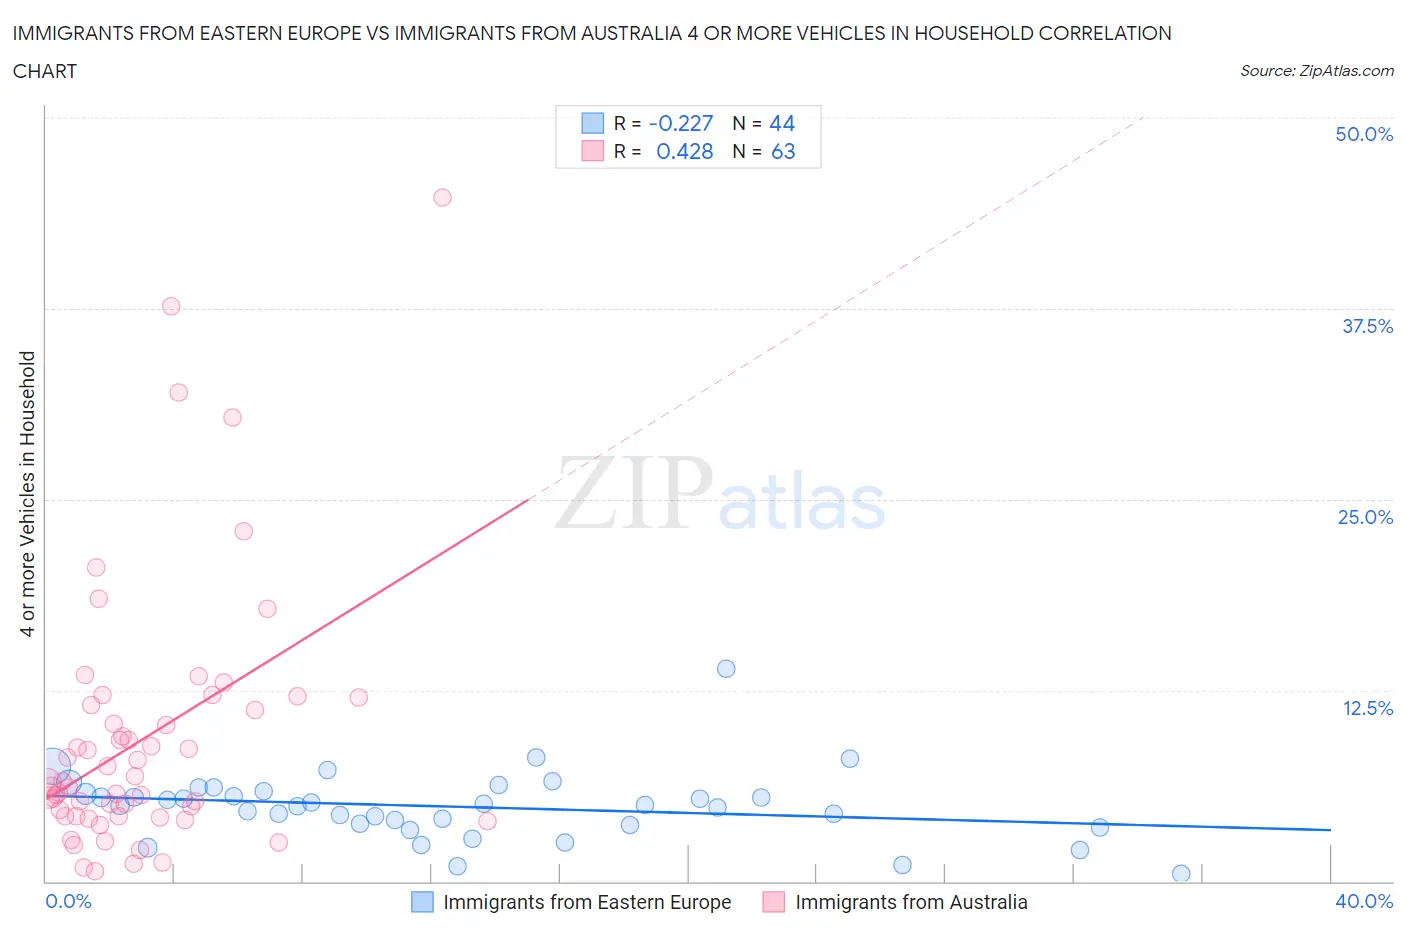
Immigrants from Eastern Europe vs Immigrants from Australia 4 or more Vehicles in Household Correlation Chart
The statistical analysis conducted on geographies consisting of 473,333,841 people shows a weak negative correlation between the proportion of Immigrants from Eastern Europe and percentage of households with 4 or more vehicles available in the United States with a correlation coefficient (R) of -0.227 and weighted average of 5.4%. Similarly, the statistical analysis conducted on geographies consisting of 226,216,978 people shows a moderate positive correlation between the proportion of Immigrants from Australia and percentage of households with 4 or more vehicles available in the United States with a correlation coefficient (R) of 0.428 and weighted average of 5.8%, a difference of 6.9%.
4 or more Vehicles in Household Correlation Summary
| Measurement | Immigrants from Eastern Europe | Immigrants from Australia |
| Minimum | 0.50% | 0.65% |
| Maximum | 13.9% | 44.7% |
| Range | 13.4% | 44.1% |
| Mean | 4.9% | 9.3% |
| Median | 5.0% | 6.5% |
| Interquartile 25% (IQ1) | 3.7% | 4.2% |
| Interquartile 75% (IQ3) | 5.8% | 11.6% |
| Interquartile Range (IQR) | 2.1% | 7.3% |
| Standard Deviation (Sample) | 2.3% | 8.6% |
| Standard Deviation (Population) | 2.2% | 8.5% |
Similar Demographics by 4 or more Vehicles in Household
Demographics Similar to Immigrants from Eastern Europe by 4 or more Vehicles in Household
In terms of 4 or more vehicles in household, the demographic groups most similar to Immigrants from Eastern Europe are Immigrants from Uruguay (5.4%, a difference of 0.46%), Alsatian (5.4%, a difference of 0.47%), Immigrants from Western Africa (5.4%, a difference of 0.54%), Immigrants from Spain (5.4%, a difference of 0.71%), and Immigrants from Ireland (5.4%, a difference of 0.79%).
| Demographics | Rating | Rank | 4 or more Vehicles in Household |
| Immigrants | Sudan | 0.6 /100 | #271 | Tragic 5.5% |
| Immigrants | Kazakhstan | 0.6 /100 | #272 | Tragic 5.5% |
| Macedonians | 0.6 /100 | #273 | Tragic 5.5% |
| Blacks/African Americans | 0.6 /100 | #274 | Tragic 5.5% |
| Cambodians | 0.5 /100 | #275 | Tragic 5.5% |
| Immigrants | Latvia | 0.5 /100 | #276 | Tragic 5.5% |
| Immigrants | Bulgaria | 0.5 /100 | #277 | Tragic 5.5% |
| Immigrants | Eastern Europe | 0.4 /100 | #278 | Tragic 5.4% |
| Immigrants | Uruguay | 0.3 /100 | #279 | Tragic 5.4% |
| Alsatians | 0.3 /100 | #280 | Tragic 5.4% |
| Immigrants | Western Africa | 0.3 /100 | #281 | Tragic 5.4% |
| Immigrants | Spain | 0.3 /100 | #282 | Tragic 5.4% |
| Immigrants | Ireland | 0.3 /100 | #283 | Tragic 5.4% |
| Brazilians | 0.3 /100 | #284 | Tragic 5.4% |
| Immigrants | Liberia | 0.2 /100 | #285 | Tragic 5.4% |
Demographics Similar to Immigrants from Australia by 4 or more Vehicles in Household
In terms of 4 or more vehicles in household, the demographic groups most similar to Immigrants from Australia are Immigrants from Poland (5.8%, a difference of 0.040%), Immigrants from Belgium (5.8%, a difference of 0.090%), Mongolian (5.8%, a difference of 0.14%), Turkish (5.8%, a difference of 0.22%), and Immigrants from Middle Africa (5.8%, a difference of 0.35%).
| Demographics | Rating | Rank | 4 or more Vehicles in Household |
| Immigrants | Argentina | 6.0 /100 | #232 | Tragic 5.9% |
| Sierra Leoneans | 6.0 /100 | #233 | Tragic 5.9% |
| Africans | 4.6 /100 | #234 | Tragic 5.8% |
| Immigrants | Hungary | 4.6 /100 | #235 | Tragic 5.8% |
| Immigrants | Eritrea | 4.5 /100 | #236 | Tragic 5.8% |
| Turks | 4.1 /100 | #237 | Tragic 5.8% |
| Immigrants | Belgium | 4.0 /100 | #238 | Tragic 5.8% |
| Immigrants | Australia | 3.8 /100 | #239 | Tragic 5.8% |
| Immigrants | Poland | 3.8 /100 | #240 | Tragic 5.8% |
| Mongolians | 3.7 /100 | #241 | Tragic 5.8% |
| Immigrants | Middle Africa | 3.4 /100 | #242 | Tragic 5.8% |
| Immigrants | Czechoslovakia | 3.2 /100 | #243 | Tragic 5.8% |
| Ethiopians | 3.2 /100 | #244 | Tragic 5.8% |
| Bulgarians | 3.1 /100 | #245 | Tragic 5.8% |
| Immigrants | North Macedonia | 2.5 /100 | #246 | Tragic 5.7% |