Immigrants from Uruguay vs Belgian 4 or more Vehicles in Household
COMPARE
Immigrants from Uruguay
Belgian
4 or more Vehicles in Household
4 or more Vehicles in Household Comparison
Immigrants from Uruguay
Belgians
5.4%
4 OR MORE VEHICLES IN HOUSEHOLD
0.3/ 100
METRIC RATING
279th/ 347
METRIC RANK
6.8%
4 OR MORE VEHICLES IN HOUSEHOLD
94.1/ 100
METRIC RATING
126th/ 347
METRIC RANK
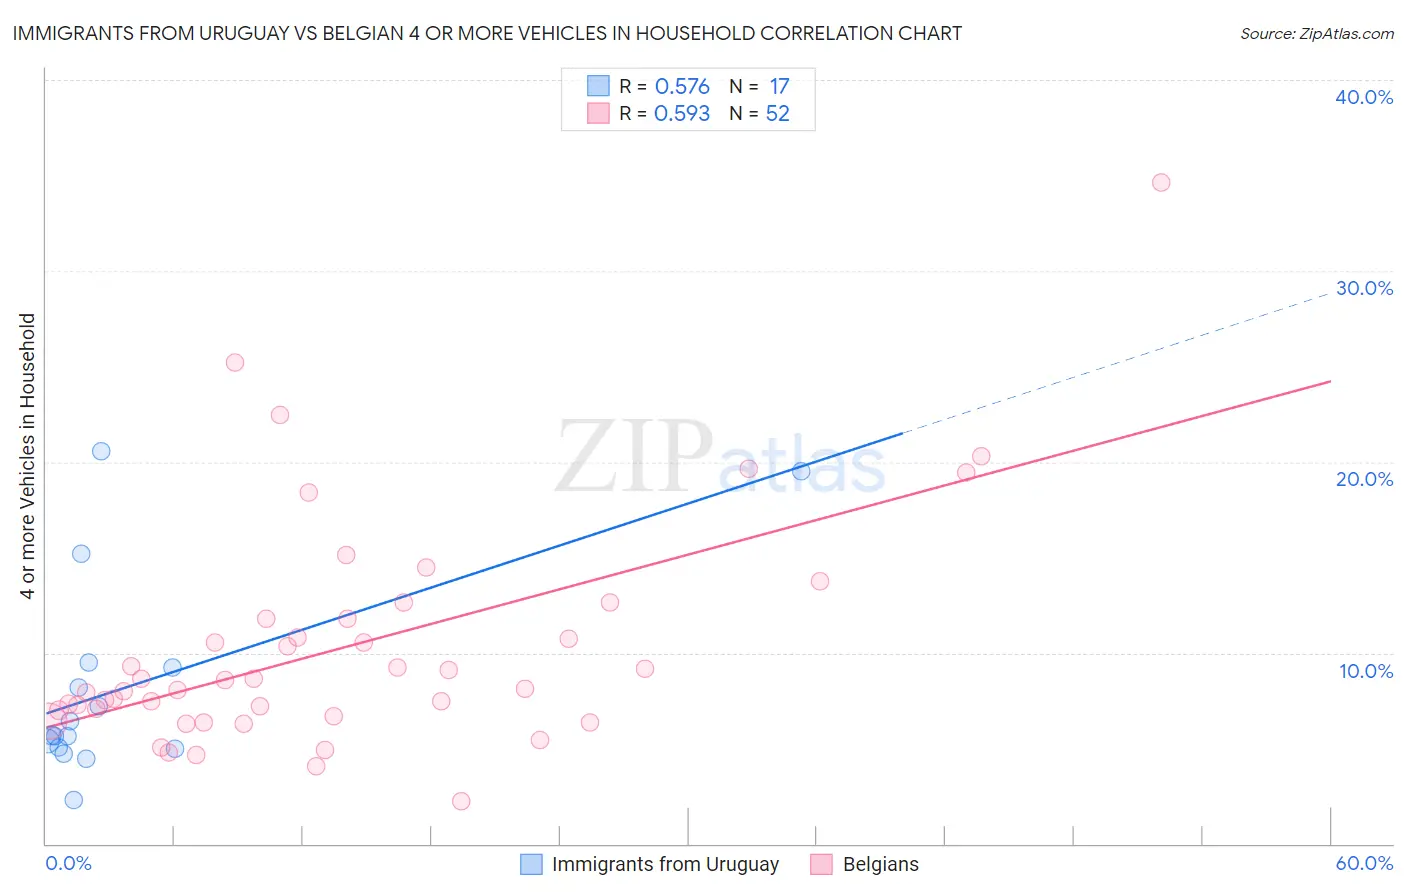
Immigrants from Uruguay vs Belgian 4 or more Vehicles in Household Correlation Chart
The statistical analysis conducted on geographies consisting of 132,880,755 people shows a substantial positive correlation between the proportion of Immigrants from Uruguay and percentage of households with 4 or more vehicles available in the United States with a correlation coefficient (R) of 0.576 and weighted average of 5.4%. Similarly, the statistical analysis conducted on geographies consisting of 354,799,341 people shows a substantial positive correlation between the proportion of Belgians and percentage of households with 4 or more vehicles available in the United States with a correlation coefficient (R) of 0.593 and weighted average of 6.8%, a difference of 25.1%.
4 or more Vehicles in Household Correlation Summary
| Measurement | Immigrants from Uruguay | Belgian |
| Minimum | 2.3% | 2.2% |
| Maximum | 20.5% | 34.6% |
| Range | 18.2% | 32.4% |
| Mean | 8.2% | 10.3% |
| Median | 5.7% | 8.3% |
| Interquartile 25% (IQ1) | 5.0% | 6.8% |
| Interquartile 75% (IQ3) | 9.4% | 11.8% |
| Interquartile Range (IQR) | 4.4% | 4.9% |
| Standard Deviation (Sample) | 5.3% | 6.0% |
| Standard Deviation (Population) | 5.1% | 5.9% |
Similar Demographics by 4 or more Vehicles in Household
Demographics Similar to Immigrants from Uruguay by 4 or more Vehicles in Household
In terms of 4 or more vehicles in household, the demographic groups most similar to Immigrants from Uruguay are Alsatian (5.4%, a difference of 0.010%), Immigrants from Western Africa (5.4%, a difference of 0.080%), Immigrants from Spain (5.4%, a difference of 0.25%), Immigrants from Ireland (5.4%, a difference of 0.33%), and Immigrants from Eastern Europe (5.4%, a difference of 0.46%).
| Demographics | Rating | Rank | 4 or more Vehicles in Household |
| Immigrants | Kazakhstan | 0.6 /100 | #272 | Tragic 5.5% |
| Macedonians | 0.6 /100 | #273 | Tragic 5.5% |
| Blacks/African Americans | 0.6 /100 | #274 | Tragic 5.5% |
| Cambodians | 0.5 /100 | #275 | Tragic 5.5% |
| Immigrants | Latvia | 0.5 /100 | #276 | Tragic 5.5% |
| Immigrants | Bulgaria | 0.5 /100 | #277 | Tragic 5.5% |
| Immigrants | Eastern Europe | 0.4 /100 | #278 | Tragic 5.4% |
| Immigrants | Uruguay | 0.3 /100 | #279 | Tragic 5.4% |
| Alsatians | 0.3 /100 | #280 | Tragic 5.4% |
| Immigrants | Western Africa | 0.3 /100 | #281 | Tragic 5.4% |
| Immigrants | Spain | 0.3 /100 | #282 | Tragic 5.4% |
| Immigrants | Ireland | 0.3 /100 | #283 | Tragic 5.4% |
| Brazilians | 0.3 /100 | #284 | Tragic 5.4% |
| Immigrants | Liberia | 0.2 /100 | #285 | Tragic 5.4% |
| Immigrants | Colombia | 0.2 /100 | #286 | Tragic 5.4% |
Demographics Similar to Belgians by 4 or more Vehicles in Household
In terms of 4 or more vehicles in household, the demographic groups most similar to Belgians are Austrian (6.8%, a difference of 0.010%), Immigrants from Asia (6.8%, a difference of 0.10%), Immigrants from Korea (6.8%, a difference of 0.12%), Immigrants (6.8%, a difference of 0.20%), and Immigrants from Germany (6.8%, a difference of 0.27%).
| Demographics | Rating | Rank | 4 or more Vehicles in Household |
| Costa Ricans | 95.5 /100 | #119 | Exceptional 6.8% |
| Comanche | 94.8 /100 | #120 | Exceptional 6.8% |
| Immigrants | Germany | 94.7 /100 | #121 | Exceptional 6.8% |
| Immigrants | Nicaragua | 94.7 /100 | #122 | Exceptional 6.8% |
| Immigrants | Immigrants | 94.6 /100 | #123 | Exceptional 6.8% |
| Immigrants | Asia | 94.4 /100 | #124 | Exceptional 6.8% |
| Austrians | 94.1 /100 | #125 | Exceptional 6.8% |
| Belgians | 94.1 /100 | #126 | Exceptional 6.8% |
| Immigrants | Korea | 93.8 /100 | #127 | Exceptional 6.8% |
| Immigrants | Bolivia | 92.5 /100 | #128 | Exceptional 6.7% |
| Immigrants | England | 92.0 /100 | #129 | Exceptional 6.7% |
| Immigrants | Scotland | 89.0 /100 | #130 | Excellent 6.7% |
| Maltese | 88.4 /100 | #131 | Excellent 6.7% |
| Immigrants | Netherlands | 87.8 /100 | #132 | Excellent 6.6% |
| Armenians | 86.9 /100 | #133 | Excellent 6.6% |