Immigrants from Uruguay vs Hispanic or Latino 4 or more Vehicles in Household
COMPARE
Immigrants from Uruguay
Hispanic or Latino
4 or more Vehicles in Household
4 or more Vehicles in Household Comparison
Immigrants from Uruguay
Hispanics or Latinos
5.4%
4 OR MORE VEHICLES IN HOUSEHOLD
0.3/ 100
METRIC RATING
279th/ 347
METRIC RANK
7.6%
4 OR MORE VEHICLES IN HOUSEHOLD
100.0/ 100
METRIC RATING
59th/ 347
METRIC RANK
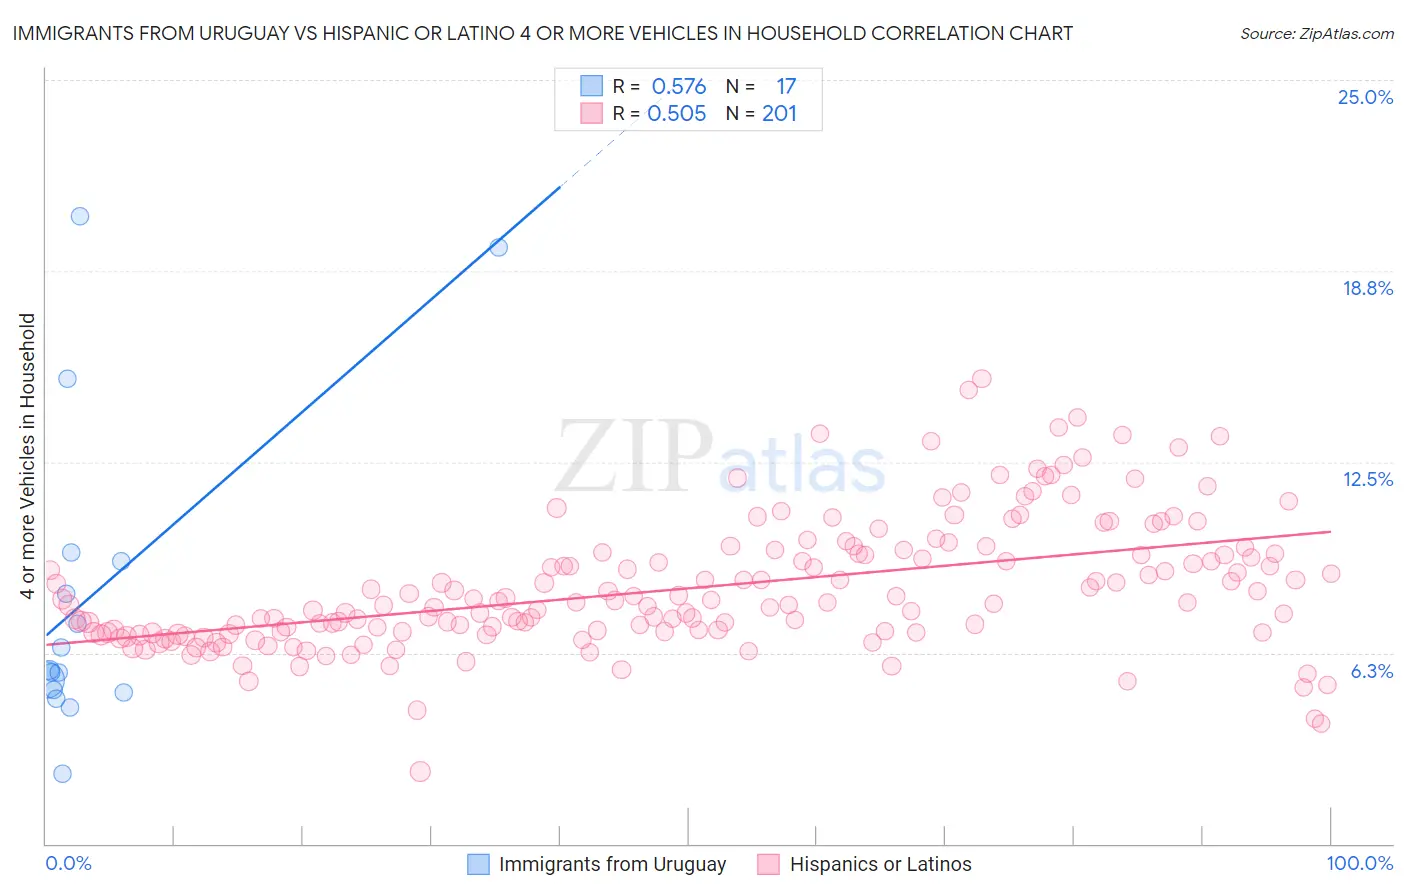
Immigrants from Uruguay vs Hispanic or Latino 4 or more Vehicles in Household Correlation Chart
The statistical analysis conducted on geographies consisting of 132,880,755 people shows a substantial positive correlation between the proportion of Immigrants from Uruguay and percentage of households with 4 or more vehicles available in the United States with a correlation coefficient (R) of 0.576 and weighted average of 5.4%. Similarly, the statistical analysis conducted on geographies consisting of 574,511,520 people shows a substantial positive correlation between the proportion of Hispanics or Latinos and percentage of households with 4 or more vehicles available in the United States with a correlation coefficient (R) of 0.505 and weighted average of 7.6%, a difference of 40.8%.
4 or more Vehicles in Household Correlation Summary
| Measurement | Immigrants from Uruguay | Hispanic or Latino |
| Minimum | 2.3% | 2.4% |
| Maximum | 20.5% | 15.2% |
| Range | 18.2% | 12.9% |
| Mean | 8.2% | 8.4% |
| Median | 5.7% | 7.9% |
| Interquartile 25% (IQ1) | 5.0% | 6.9% |
| Interquartile 75% (IQ3) | 9.4% | 9.5% |
| Interquartile Range (IQR) | 4.4% | 2.6% |
| Standard Deviation (Sample) | 5.3% | 2.1% |
| Standard Deviation (Population) | 5.1% | 2.1% |
Similar Demographics by 4 or more Vehicles in Household
Demographics Similar to Immigrants from Uruguay by 4 or more Vehicles in Household
In terms of 4 or more vehicles in household, the demographic groups most similar to Immigrants from Uruguay are Alsatian (5.4%, a difference of 0.010%), Immigrants from Western Africa (5.4%, a difference of 0.080%), Immigrants from Spain (5.4%, a difference of 0.25%), Immigrants from Ireland (5.4%, a difference of 0.33%), and Immigrants from Eastern Europe (5.4%, a difference of 0.46%).
| Demographics | Rating | Rank | 4 or more Vehicles in Household |
| Immigrants | Kazakhstan | 0.6 /100 | #272 | Tragic 5.5% |
| Macedonians | 0.6 /100 | #273 | Tragic 5.5% |
| Blacks/African Americans | 0.6 /100 | #274 | Tragic 5.5% |
| Cambodians | 0.5 /100 | #275 | Tragic 5.5% |
| Immigrants | Latvia | 0.5 /100 | #276 | Tragic 5.5% |
| Immigrants | Bulgaria | 0.5 /100 | #277 | Tragic 5.5% |
| Immigrants | Eastern Europe | 0.4 /100 | #278 | Tragic 5.4% |
| Immigrants | Uruguay | 0.3 /100 | #279 | Tragic 5.4% |
| Alsatians | 0.3 /100 | #280 | Tragic 5.4% |
| Immigrants | Western Africa | 0.3 /100 | #281 | Tragic 5.4% |
| Immigrants | Spain | 0.3 /100 | #282 | Tragic 5.4% |
| Immigrants | Ireland | 0.3 /100 | #283 | Tragic 5.4% |
| Brazilians | 0.3 /100 | #284 | Tragic 5.4% |
| Immigrants | Liberia | 0.2 /100 | #285 | Tragic 5.4% |
| Immigrants | Colombia | 0.2 /100 | #286 | Tragic 5.4% |
Demographics Similar to Hispanics or Latinos by 4 or more Vehicles in Household
In terms of 4 or more vehicles in household, the demographic groups most similar to Hispanics or Latinos are Pennsylvania German (7.6%, a difference of 0.040%), Swedish (7.6%, a difference of 0.040%), Spaniard (7.6%, a difference of 0.060%), English (7.6%, a difference of 0.16%), and Immigrants from Oceania (7.6%, a difference of 0.17%).
| Demographics | Rating | Rank | 4 or more Vehicles in Household |
| Japanese | 100.0 /100 | #52 | Exceptional 7.7% |
| Malaysians | 100.0 /100 | #53 | Exceptional 7.7% |
| Dutch | 100.0 /100 | #54 | Exceptional 7.7% |
| Immigrants | Oceania | 100.0 /100 | #55 | Exceptional 7.6% |
| English | 100.0 /100 | #56 | Exceptional 7.6% |
| Pennsylvania Germans | 100.0 /100 | #57 | Exceptional 7.6% |
| Swedes | 100.0 /100 | #58 | Exceptional 7.6% |
| Hispanics or Latinos | 100.0 /100 | #59 | Exceptional 7.6% |
| Spaniards | 100.0 /100 | #60 | Exceptional 7.6% |
| Europeans | 100.0 /100 | #61 | Exceptional 7.6% |
| Chippewa | 100.0 /100 | #62 | Exceptional 7.6% |
| Immigrants | Micronesia | 100.0 /100 | #63 | Exceptional 7.6% |
| Bangladeshis | 100.0 /100 | #64 | Exceptional 7.6% |
| Immigrants | Azores | 100.0 /100 | #65 | Exceptional 7.5% |
| Immigrants | Taiwan | 99.9 /100 | #66 | Exceptional 7.5% |