Immigrants from Uruguay vs Honduran 4 or more Vehicles in Household
COMPARE
Immigrants from Uruguay
Honduran
4 or more Vehicles in Household
4 or more Vehicles in Household Comparison
Immigrants from Uruguay
Hondurans
5.4%
4 OR MORE VEHICLES IN HOUSEHOLD
0.3/ 100
METRIC RATING
279th/ 347
METRIC RANK
6.1%
4 OR MORE VEHICLES IN HOUSEHOLD
19.3/ 100
METRIC RATING
205th/ 347
METRIC RANK
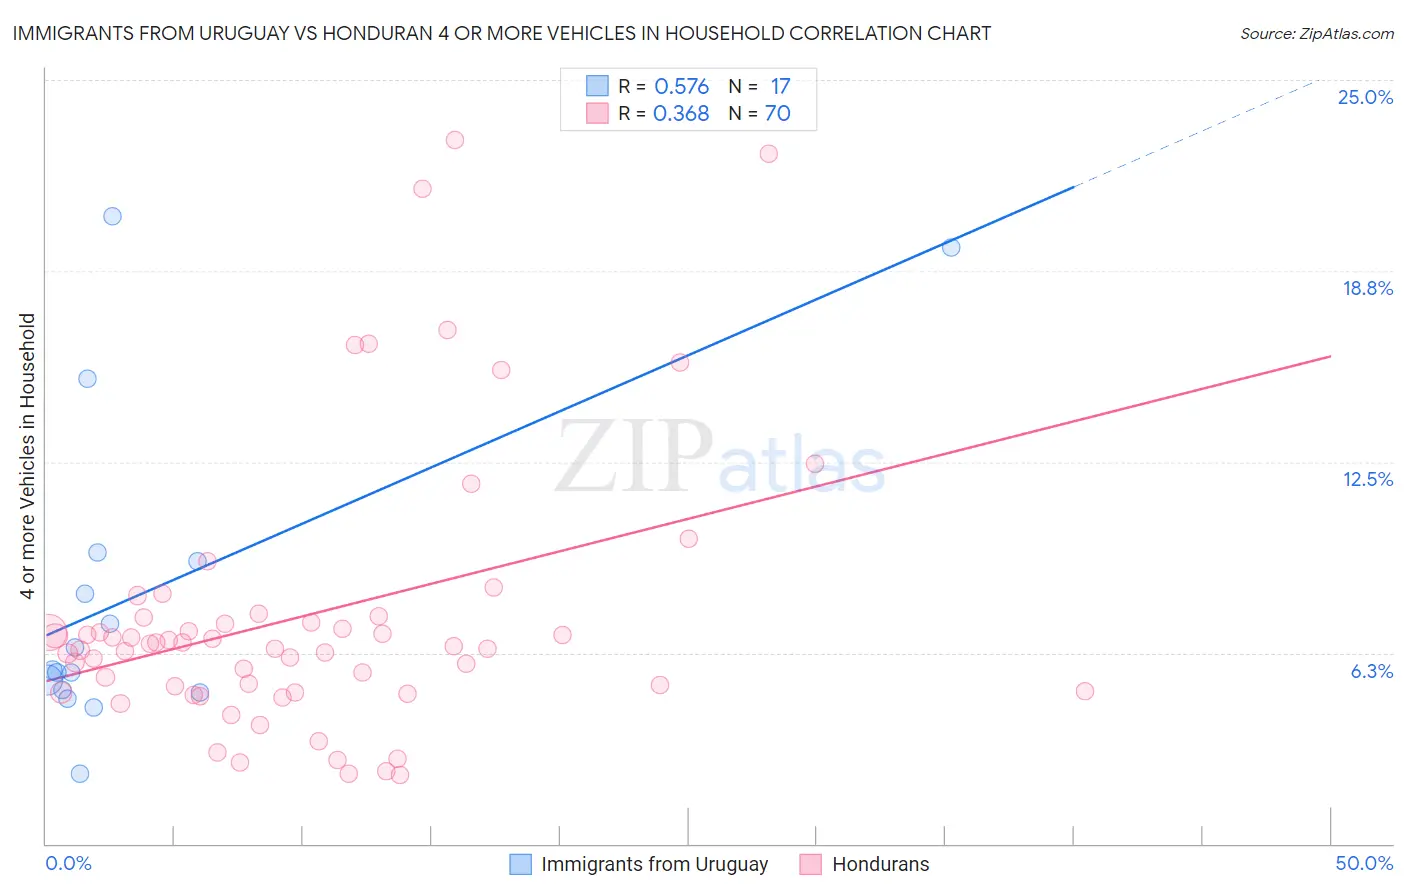
Immigrants from Uruguay vs Honduran 4 or more Vehicles in Household Correlation Chart
The statistical analysis conducted on geographies consisting of 132,880,755 people shows a substantial positive correlation between the proportion of Immigrants from Uruguay and percentage of households with 4 or more vehicles available in the United States with a correlation coefficient (R) of 0.576 and weighted average of 5.4%. Similarly, the statistical analysis conducted on geographies consisting of 356,171,114 people shows a mild positive correlation between the proportion of Hondurans and percentage of households with 4 or more vehicles available in the United States with a correlation coefficient (R) of 0.368 and weighted average of 6.1%, a difference of 12.7%.
4 or more Vehicles in Household Correlation Summary
| Measurement | Immigrants from Uruguay | Honduran |
| Minimum | 2.3% | 2.2% |
| Maximum | 20.5% | 23.0% |
| Range | 18.2% | 20.8% |
| Mean | 8.2% | 7.5% |
| Median | 5.7% | 6.5% |
| Interquartile 25% (IQ1) | 5.0% | 5.0% |
| Interquartile 75% (IQ3) | 9.4% | 7.4% |
| Interquartile Range (IQR) | 4.4% | 2.4% |
| Standard Deviation (Sample) | 5.3% | 4.5% |
| Standard Deviation (Population) | 5.1% | 4.5% |
Similar Demographics by 4 or more Vehicles in Household
Demographics Similar to Immigrants from Uruguay by 4 or more Vehicles in Household
In terms of 4 or more vehicles in household, the demographic groups most similar to Immigrants from Uruguay are Alsatian (5.4%, a difference of 0.010%), Immigrants from Western Africa (5.4%, a difference of 0.080%), Immigrants from Spain (5.4%, a difference of 0.25%), Immigrants from Ireland (5.4%, a difference of 0.33%), and Immigrants from Eastern Europe (5.4%, a difference of 0.46%).
| Demographics | Rating | Rank | 4 or more Vehicles in Household |
| Immigrants | Kazakhstan | 0.6 /100 | #272 | Tragic 5.5% |
| Macedonians | 0.6 /100 | #273 | Tragic 5.5% |
| Blacks/African Americans | 0.6 /100 | #274 | Tragic 5.5% |
| Cambodians | 0.5 /100 | #275 | Tragic 5.5% |
| Immigrants | Latvia | 0.5 /100 | #276 | Tragic 5.5% |
| Immigrants | Bulgaria | 0.5 /100 | #277 | Tragic 5.5% |
| Immigrants | Eastern Europe | 0.4 /100 | #278 | Tragic 5.4% |
| Immigrants | Uruguay | 0.3 /100 | #279 | Tragic 5.4% |
| Alsatians | 0.3 /100 | #280 | Tragic 5.4% |
| Immigrants | Western Africa | 0.3 /100 | #281 | Tragic 5.4% |
| Immigrants | Spain | 0.3 /100 | #282 | Tragic 5.4% |
| Immigrants | Ireland | 0.3 /100 | #283 | Tragic 5.4% |
| Brazilians | 0.3 /100 | #284 | Tragic 5.4% |
| Immigrants | Liberia | 0.2 /100 | #285 | Tragic 5.4% |
| Immigrants | Colombia | 0.2 /100 | #286 | Tragic 5.4% |
Demographics Similar to Hondurans by 4 or more Vehicles in Household
In terms of 4 or more vehicles in household, the demographic groups most similar to Hondurans are Immigrants from Belize (6.1%, a difference of 0.090%), Kenyan (6.1%, a difference of 0.14%), Immigrants from Sierra Leone (6.1%, a difference of 0.19%), Immigrants from South Central Asia (6.1%, a difference of 0.33%), and Egyptian (6.1%, a difference of 0.34%).
| Demographics | Rating | Rank | 4 or more Vehicles in Household |
| Immigrants | Portugal | 22.3 /100 | #198 | Fair 6.1% |
| Immigrants | Norway | 21.8 /100 | #199 | Fair 6.1% |
| Latvians | 21.7 /100 | #200 | Fair 6.1% |
| Egyptians | 21.4 /100 | #201 | Fair 6.1% |
| Immigrants | South Central Asia | 21.3 /100 | #202 | Fair 6.1% |
| Immigrants | Sierra Leone | 20.5 /100 | #203 | Fair 6.1% |
| Immigrants | Belize | 19.8 /100 | #204 | Poor 6.1% |
| Hondurans | 19.3 /100 | #205 | Poor 6.1% |
| Kenyans | 18.5 /100 | #206 | Poor 6.1% |
| Immigrants | Chile | 16.9 /100 | #207 | Poor 6.1% |
| Immigrants | Nigeria | 15.6 /100 | #208 | Poor 6.1% |
| Immigrants | Honduras | 15.4 /100 | #209 | Poor 6.1% |
| Immigrants | Zimbabwe | 15.1 /100 | #210 | Poor 6.0% |
| Panamanians | 14.8 /100 | #211 | Poor 6.0% |
| Immigrants | Egypt | 14.7 /100 | #212 | Poor 6.0% |