Immigrants from Uruguay vs Immigrants from Lithuania Single Mother Households
COMPARE
Immigrants from Uruguay
Immigrants from Lithuania
Single Mother Households
Single Mother Households Comparison
Immigrants from Uruguay
Immigrants from Lithuania
6.7%
SINGLE MOTHER HOUSEHOLDS
7.9/ 100
METRIC RATING
214th/ 347
METRIC RANK
5.3%
SINGLE MOTHER HOUSEHOLDS
99.8/ 100
METRIC RATING
26th/ 347
METRIC RANK
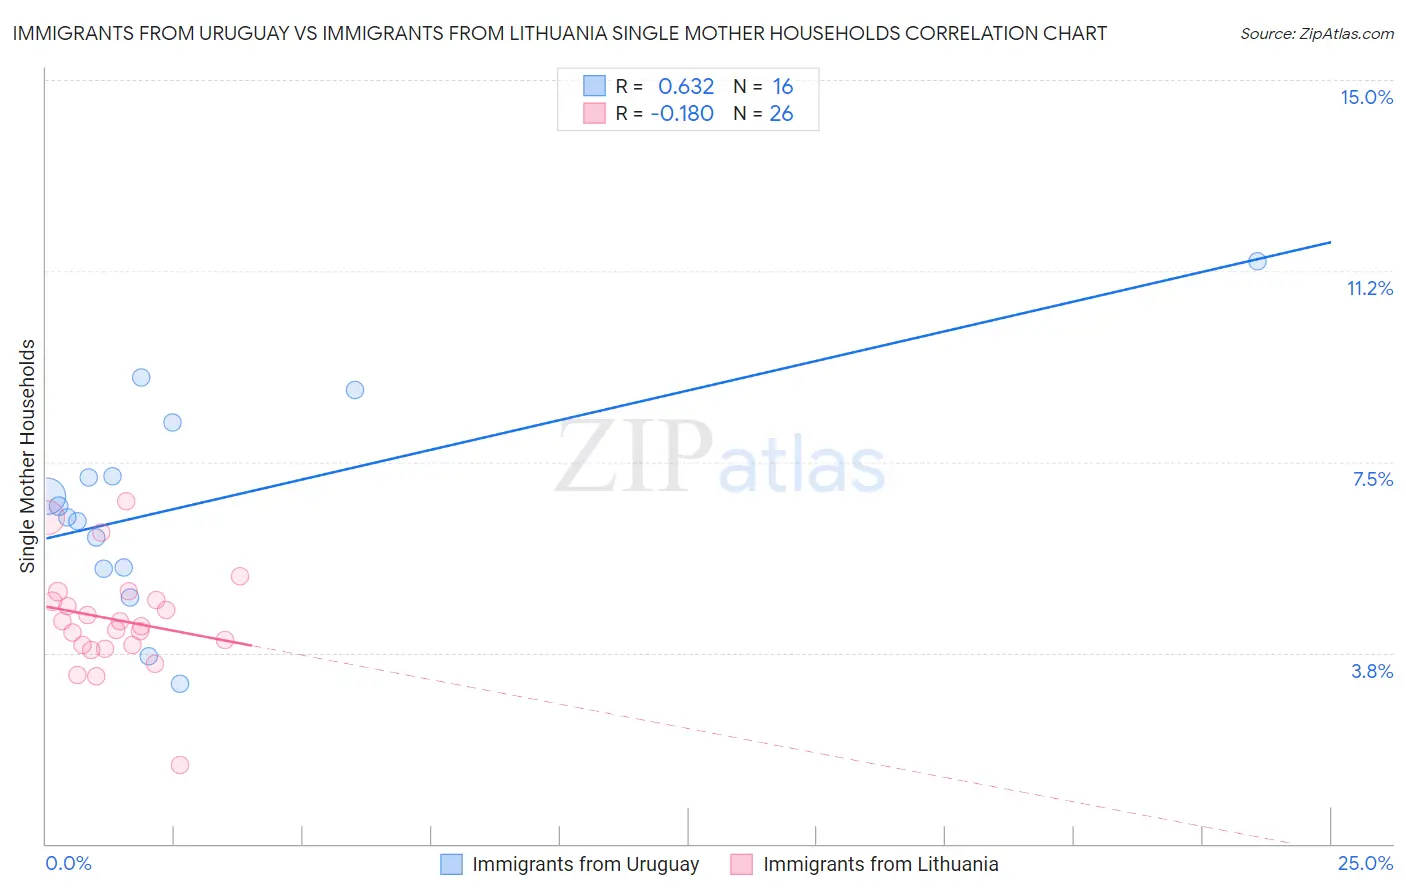
Immigrants from Uruguay vs Immigrants from Lithuania Single Mother Households Correlation Chart
The statistical analysis conducted on geographies consisting of 133,194,023 people shows a significant positive correlation between the proportion of Immigrants from Uruguay and percentage of single mother households in the United States with a correlation coefficient (R) of 0.632 and weighted average of 6.7%. Similarly, the statistical analysis conducted on geographies consisting of 117,657,172 people shows a poor negative correlation between the proportion of Immigrants from Lithuania and percentage of single mother households in the United States with a correlation coefficient (R) of -0.180 and weighted average of 5.3%, a difference of 28.2%.
Single Mother Households Correlation Summary
| Measurement | Immigrants from Uruguay | Immigrants from Lithuania |
| Minimum | 3.1% | 1.5% |
| Maximum | 11.4% | 6.7% |
| Range | 8.3% | 5.2% |
| Mean | 6.7% | 4.4% |
| Median | 6.5% | 4.3% |
| Interquartile 25% (IQ1) | 5.4% | 3.9% |
| Interquartile 75% (IQ3) | 7.7% | 4.8% |
| Interquartile Range (IQR) | 2.3% | 0.89% |
| Standard Deviation (Sample) | 2.1% | 1.0% |
| Standard Deviation (Population) | 2.0% | 1.0% |
Similar Demographics by Single Mother Households
Demographics Similar to Immigrants from Uruguay by Single Mother Households
In terms of single mother households, the demographic groups most similar to Immigrants from Uruguay are Immigrants from Costa Rica (6.7%, a difference of 0.11%), Immigrants from Eritrea (6.7%, a difference of 0.16%), Immigrants from Venezuela (6.7%, a difference of 0.22%), Nonimmigrants (6.7%, a difference of 0.80%), and Immigrants from Colombia (6.7%, a difference of 0.82%).
| Demographics | Rating | Rank | Single Mother Households |
| Immigrants | South America | 11.5 /100 | #207 | Poor 6.7% |
| Vietnamese | 11.3 /100 | #208 | Poor 6.7% |
| Immigrants | Colombia | 10.5 /100 | #209 | Poor 6.7% |
| Immigrants | Nonimmigrants | 10.4 /100 | #210 | Poor 6.7% |
| Immigrants | Venezuela | 8.5 /100 | #211 | Tragic 6.7% |
| Immigrants | Eritrea | 8.4 /100 | #212 | Tragic 6.7% |
| Immigrants | Costa Rica | 8.2 /100 | #213 | Tragic 6.7% |
| Immigrants | Uruguay | 7.9 /100 | #214 | Tragic 6.7% |
| Shoshone | 5.7 /100 | #215 | Tragic 6.8% |
| Cherokee | 5.1 /100 | #216 | Tragic 6.8% |
| Aleuts | 4.8 /100 | #217 | Tragic 6.8% |
| Immigrants | Eastern Africa | 4.4 /100 | #218 | Tragic 6.8% |
| Immigrants | Immigrants | 4.3 /100 | #219 | Tragic 6.8% |
| Immigrants | Thailand | 4.0 /100 | #220 | Tragic 6.9% |
| French American Indians | 3.7 /100 | #221 | Tragic 6.9% |
Demographics Similar to Immigrants from Lithuania by Single Mother Households
In terms of single mother households, the demographic groups most similar to Immigrants from Lithuania are Immigrants from Japan (5.2%, a difference of 0.030%), Armenian (5.2%, a difference of 0.36%), Immigrants from Austria (5.2%, a difference of 0.42%), Thai (5.2%, a difference of 0.47%), and Bhutanese (5.3%, a difference of 0.51%).
| Demographics | Rating | Rank | Single Mother Households |
| Chinese | 99.9 /100 | #19 | Exceptional 5.2% |
| Maltese | 99.9 /100 | #20 | Exceptional 5.2% |
| Eastern Europeans | 99.8 /100 | #21 | Exceptional 5.2% |
| Thais | 99.8 /100 | #22 | Exceptional 5.2% |
| Immigrants | Austria | 99.8 /100 | #23 | Exceptional 5.2% |
| Armenians | 99.8 /100 | #24 | Exceptional 5.2% |
| Immigrants | Japan | 99.8 /100 | #25 | Exceptional 5.2% |
| Immigrants | Lithuania | 99.8 /100 | #26 | Exceptional 5.3% |
| Bhutanese | 99.7 /100 | #27 | Exceptional 5.3% |
| Russians | 99.7 /100 | #28 | Exceptional 5.3% |
| Latvians | 99.7 /100 | #29 | Exceptional 5.3% |
| Burmese | 99.7 /100 | #30 | Exceptional 5.3% |
| Immigrants | Korea | 99.7 /100 | #31 | Exceptional 5.3% |
| Cambodians | 99.7 /100 | #32 | Exceptional 5.3% |
| Immigrants | Switzerland | 99.7 /100 | #33 | Exceptional 5.3% |