Immigrants from Uganda vs Yuman 1 or more Vehicles in Household
COMPARE
Immigrants from Uganda
Yuman
1 or more Vehicles in Household
1 or more Vehicles in Household Comparison
Immigrants from Uganda
Yuman
90.1%
1 OR MORE VEHICLES IN HOUSEHOLD
73.8/ 100
METRIC RATING
154th/ 347
METRIC RANK
85.5%
1 OR MORE VEHICLES IN HOUSEHOLD
0.0/ 100
METRIC RATING
299th/ 347
METRIC RANK
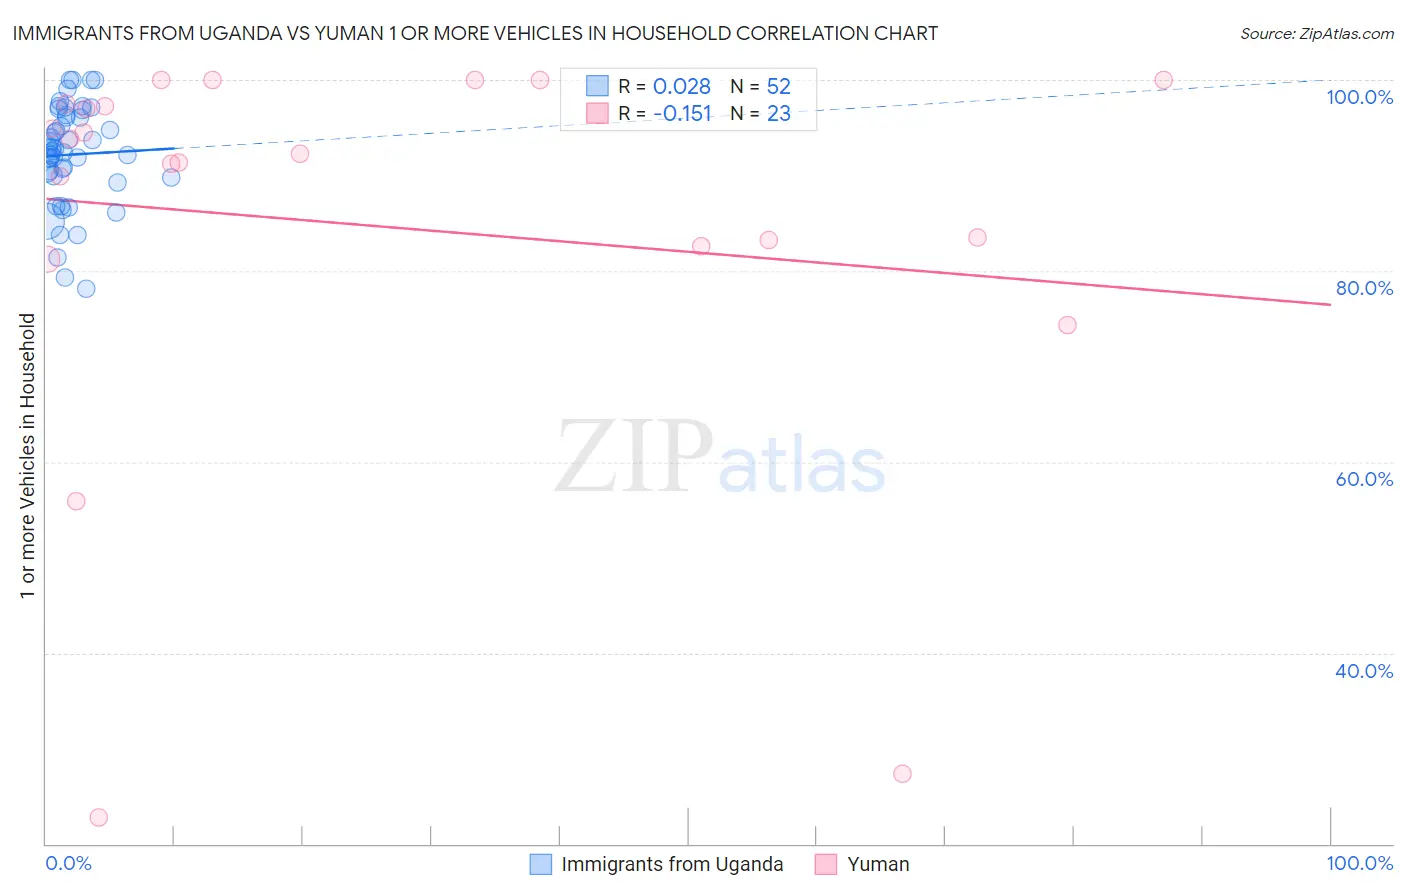
Immigrants from Uganda vs Yuman 1 or more Vehicles in Household Correlation Chart
The statistical analysis conducted on geographies consisting of 125,961,827 people shows no correlation between the proportion of Immigrants from Uganda and percentage of households with 1 or more vehicles available in the United States with a correlation coefficient (R) of 0.028 and weighted average of 90.1%. Similarly, the statistical analysis conducted on geographies consisting of 40,663,643 people shows a poor negative correlation between the proportion of Yuman and percentage of households with 1 or more vehicles available in the United States with a correlation coefficient (R) of -0.151 and weighted average of 85.5%, a difference of 5.4%.
1 or more Vehicles in Household Correlation Summary
| Measurement | Immigrants from Uganda | Yuman |
| Minimum | 78.1% | 22.7% |
| Maximum | 100.0% | 100.0% |
| Range | 21.9% | 77.3% |
| Mean | 92.2% | 84.8% |
| Median | 92.7% | 92.3% |
| Interquartile 25% (IQ1) | 89.9% | 82.6% |
| Interquartile 75% (IQ3) | 96.2% | 97.5% |
| Interquartile Range (IQR) | 6.3% | 14.8% |
| Standard Deviation (Sample) | 5.3% | 21.5% |
| Standard Deviation (Population) | 5.2% | 21.1% |
Similar Demographics by 1 or more Vehicles in Household
Demographics Similar to Immigrants from Uganda by 1 or more Vehicles in Household
In terms of 1 or more vehicles in household, the demographic groups most similar to Immigrants from Uganda are New Zealander (90.1%, a difference of 0.0%), Immigrants (90.1%, a difference of 0.0%), Tlingit-Haida (90.1%, a difference of 0.010%), Immigrants from Bosnia and Herzegovina (90.1%, a difference of 0.030%), and Australian (90.0%, a difference of 0.030%).
| Demographics | Rating | Rank | 1 or more Vehicles in Household |
| Chileans | 79.8 /100 | #147 | Good 90.2% |
| Immigrants | Eastern Africa | 78.2 /100 | #148 | Good 90.1% |
| Immigrants | Nicaragua | 76.7 /100 | #149 | Good 90.1% |
| Immigrants | Micronesia | 75.9 /100 | #150 | Good 90.1% |
| Immigrants | Bosnia and Herzegovina | 75.4 /100 | #151 | Good 90.1% |
| Tlingit-Haida | 74.3 /100 | #152 | Good 90.1% |
| New Zealanders | 73.8 /100 | #153 | Good 90.1% |
| Immigrants | Uganda | 73.8 /100 | #154 | Good 90.1% |
| Immigrants | Immigrants | 73.6 /100 | #155 | Good 90.1% |
| Australians | 72.4 /100 | #156 | Good 90.0% |
| Immigrants | Congo | 71.2 /100 | #157 | Good 90.0% |
| Brazilians | 71.0 /100 | #158 | Good 90.0% |
| South Africans | 69.7 /100 | #159 | Good 90.0% |
| Immigrants | Indonesia | 68.8 /100 | #160 | Good 90.0% |
| Salvadorans | 68.7 /100 | #161 | Good 90.0% |
Demographics Similar to Yuman by 1 or more Vehicles in Household
In terms of 1 or more vehicles in household, the demographic groups most similar to Yuman are Immigrants from Russia (85.4%, a difference of 0.0%), Immigrants from Panama (85.4%, a difference of 0.050%), Moroccan (85.4%, a difference of 0.070%), Immigrants from Greece (85.4%, a difference of 0.10%), and Belizean (85.7%, a difference of 0.24%).
| Demographics | Rating | Rank | 1 or more Vehicles in Household |
| Okinawans | 0.0 /100 | #292 | Tragic 86.1% |
| Indians (Asian) | 0.0 /100 | #293 | Tragic 86.0% |
| Alaskan Athabascans | 0.0 /100 | #294 | Tragic 86.0% |
| Immigrants | Jamaica | 0.0 /100 | #295 | Tragic 85.8% |
| Immigrants | Spain | 0.0 /100 | #296 | Tragic 85.8% |
| Paraguayans | 0.0 /100 | #297 | Tragic 85.7% |
| Belizeans | 0.0 /100 | #298 | Tragic 85.7% |
| Yuman | 0.0 /100 | #299 | Tragic 85.5% |
| Immigrants | Russia | 0.0 /100 | #300 | Tragic 85.4% |
| Immigrants | Panama | 0.0 /100 | #301 | Tragic 85.4% |
| Moroccans | 0.0 /100 | #302 | Tragic 85.4% |
| Immigrants | Greece | 0.0 /100 | #303 | Tragic 85.4% |
| Immigrants | Ukraine | 0.0 /100 | #304 | Tragic 85.2% |
| Immigrants | China | 0.0 /100 | #305 | Tragic 84.9% |
| Immigrants | Western Africa | 0.0 /100 | #306 | Tragic 84.9% |