Immigrants from Israel vs Yuman 1 or more Vehicles in Household
COMPARE
Immigrants from Israel
Yuman
1 or more Vehicles in Household
1 or more Vehicles in Household Comparison
Immigrants from Israel
Yuman
84.5%
1 OR MORE VEHICLES IN HOUSEHOLD
0.0/ 100
METRIC RATING
313th/ 347
METRIC RANK
85.5%
1 OR MORE VEHICLES IN HOUSEHOLD
0.0/ 100
METRIC RATING
299th/ 347
METRIC RANK
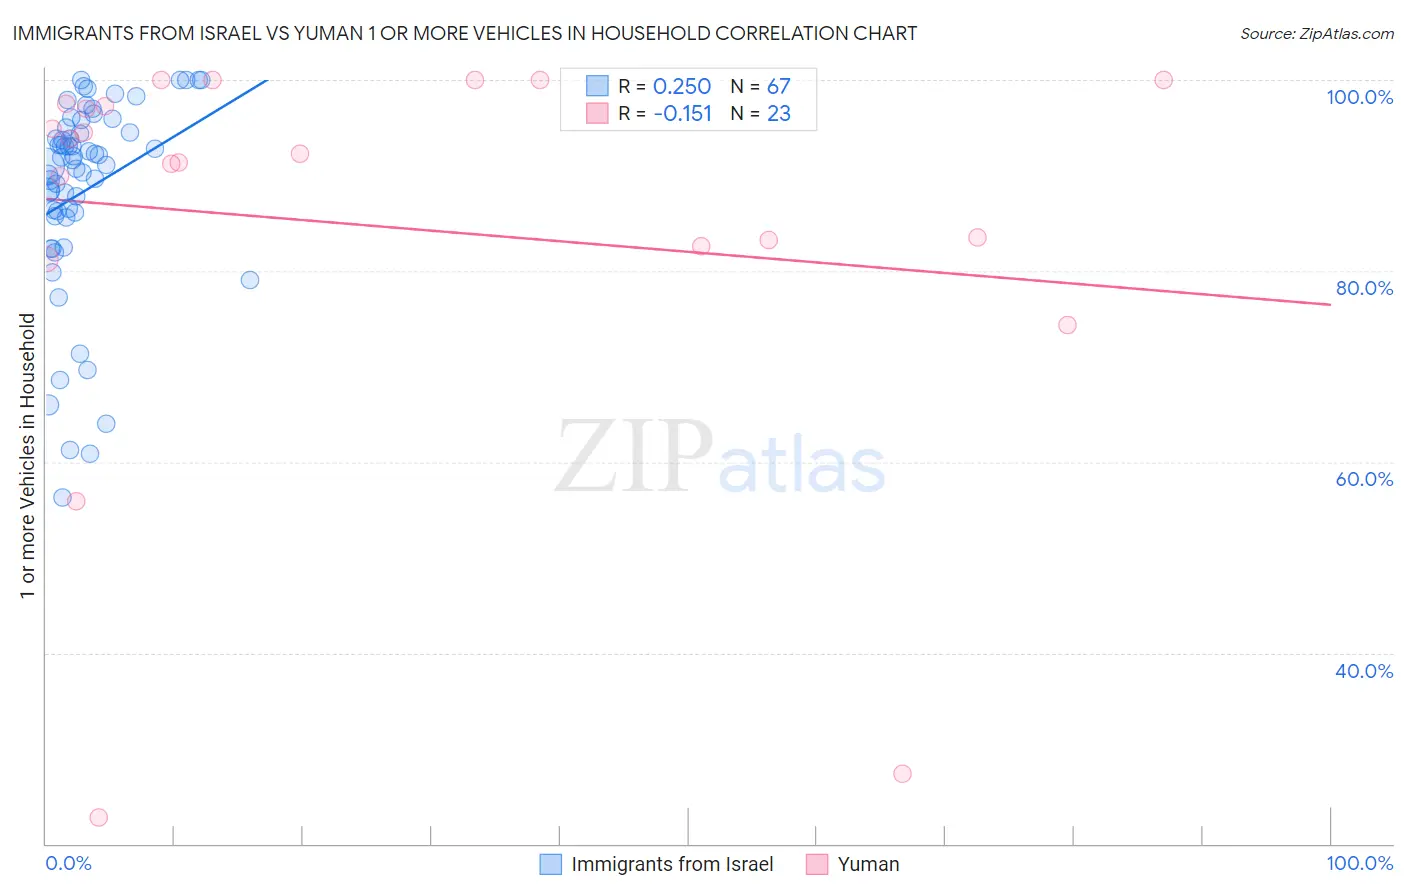
Immigrants from Israel vs Yuman 1 or more Vehicles in Household Correlation Chart
The statistical analysis conducted on geographies consisting of 209,984,574 people shows a weak positive correlation between the proportion of Immigrants from Israel and percentage of households with 1 or more vehicles available in the United States with a correlation coefficient (R) of 0.250 and weighted average of 84.5%. Similarly, the statistical analysis conducted on geographies consisting of 40,663,643 people shows a poor negative correlation between the proportion of Yuman and percentage of households with 1 or more vehicles available in the United States with a correlation coefficient (R) of -0.151 and weighted average of 85.5%, a difference of 1.1%.
1 or more Vehicles in Household Correlation Summary
| Measurement | Immigrants from Israel | Yuman |
| Minimum | 56.3% | 22.7% |
| Maximum | 100.0% | 100.0% |
| Range | 43.7% | 77.3% |
| Mean | 88.4% | 84.8% |
| Median | 91.7% | 92.3% |
| Interquartile 25% (IQ1) | 85.7% | 82.6% |
| Interquartile 75% (IQ3) | 95.1% | 97.5% |
| Interquartile Range (IQR) | 9.4% | 14.8% |
| Standard Deviation (Sample) | 10.4% | 21.5% |
| Standard Deviation (Population) | 10.3% | 21.1% |
Demographics Similar to Immigrants from Israel and Yuman by 1 or more Vehicles in Household
In terms of 1 or more vehicles in household, the demographic groups most similar to Immigrants from Israel are Cape Verdean (84.5%, a difference of 0.020%), Albanian (84.4%, a difference of 0.070%), Puerto Rican (84.6%, a difference of 0.13%), Cypriot (84.4%, a difference of 0.13%), and U.S. Virgin Islander (84.6%, a difference of 0.17%). Similarly, the demographic groups most similar to Yuman are Immigrants from Russia (85.4%, a difference of 0.0%), Immigrants from Panama (85.4%, a difference of 0.050%), Moroccan (85.4%, a difference of 0.070%), Immigrants from Greece (85.4%, a difference of 0.10%), and Belizean (85.7%, a difference of 0.24%).
| Demographics | Rating | Rank | 1 or more Vehicles in Household |
| Immigrants | Spain | 0.0 /100 | #296 | Tragic 85.8% |
| Paraguayans | 0.0 /100 | #297 | Tragic 85.7% |
| Belizeans | 0.0 /100 | #298 | Tragic 85.7% |
| Yuman | 0.0 /100 | #299 | Tragic 85.5% |
| Immigrants | Russia | 0.0 /100 | #300 | Tragic 85.4% |
| Immigrants | Panama | 0.0 /100 | #301 | Tragic 85.4% |
| Moroccans | 0.0 /100 | #302 | Tragic 85.4% |
| Immigrants | Greece | 0.0 /100 | #303 | Tragic 85.4% |
| Immigrants | Ukraine | 0.0 /100 | #304 | Tragic 85.2% |
| Immigrants | China | 0.0 /100 | #305 | Tragic 84.9% |
| Immigrants | Western Africa | 0.0 /100 | #306 | Tragic 84.9% |
| Tohono O'odham | 0.0 /100 | #307 | Tragic 84.7% |
| Immigrants | Belize | 0.0 /100 | #308 | Tragic 84.7% |
| Immigrants | Haiti | 0.0 /100 | #309 | Tragic 84.7% |
| U.S. Virgin Islanders | 0.0 /100 | #310 | Tragic 84.6% |
| Puerto Ricans | 0.0 /100 | #311 | Tragic 84.6% |
| Cape Verdeans | 0.0 /100 | #312 | Tragic 84.5% |
| Immigrants | Israel | 0.0 /100 | #313 | Tragic 84.5% |
| Albanians | 0.0 /100 | #314 | Tragic 84.4% |
| Cypriots | 0.0 /100 | #315 | Tragic 84.4% |
| Alaska Natives | 0.0 /100 | #316 | Tragic 83.8% |