Ugandan vs Yuman 1 or more Vehicles in Household
COMPARE
Ugandan
Yuman
1 or more Vehicles in Household
1 or more Vehicles in Household Comparison
Ugandans
Yuman
88.9%
1 OR MORE VEHICLES IN HOUSEHOLD
8.7/ 100
METRIC RATING
218th/ 347
METRIC RANK
85.5%
1 OR MORE VEHICLES IN HOUSEHOLD
0.0/ 100
METRIC RATING
299th/ 347
METRIC RANK
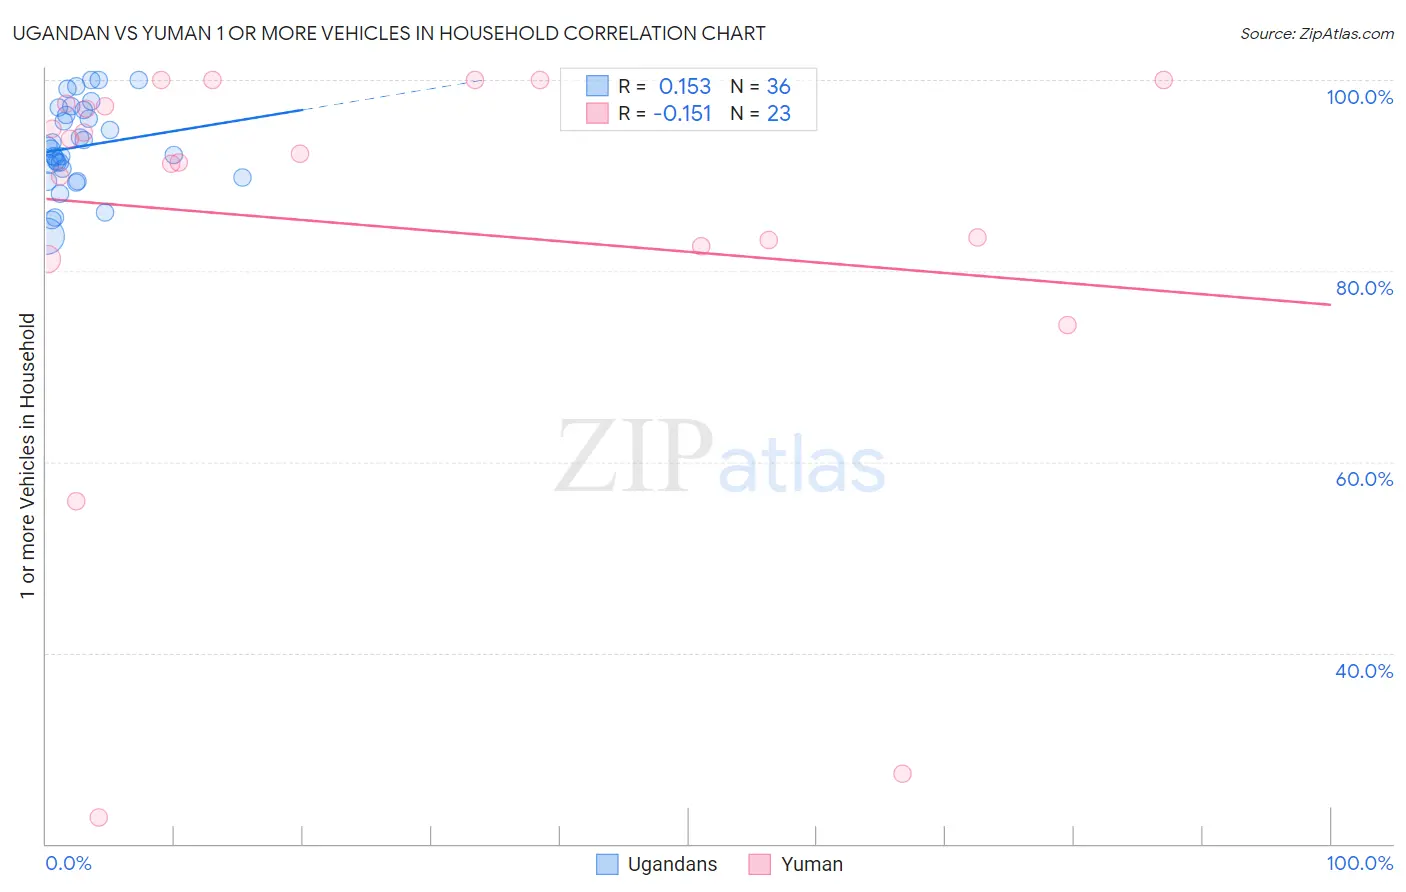
Ugandan vs Yuman 1 or more Vehicles in Household Correlation Chart
The statistical analysis conducted on geographies consisting of 93,998,632 people shows a poor positive correlation between the proportion of Ugandans and percentage of households with 1 or more vehicles available in the United States with a correlation coefficient (R) of 0.153 and weighted average of 88.9%. Similarly, the statistical analysis conducted on geographies consisting of 40,663,643 people shows a poor negative correlation between the proportion of Yuman and percentage of households with 1 or more vehicles available in the United States with a correlation coefficient (R) of -0.151 and weighted average of 85.5%, a difference of 4.0%.
1 or more Vehicles in Household Correlation Summary
| Measurement | Ugandan | Yuman |
| Minimum | 83.6% | 22.7% |
| Maximum | 100.0% | 100.0% |
| Range | 16.4% | 77.3% |
| Mean | 93.0% | 84.8% |
| Median | 92.5% | 92.3% |
| Interquartile 25% (IQ1) | 90.3% | 82.6% |
| Interquartile 75% (IQ3) | 96.6% | 97.5% |
| Interquartile Range (IQR) | 6.3% | 14.8% |
| Standard Deviation (Sample) | 4.4% | 21.5% |
| Standard Deviation (Population) | 4.3% | 21.1% |
Similar Demographics by 1 or more Vehicles in Household
Demographics Similar to Ugandans by 1 or more Vehicles in Household
In terms of 1 or more vehicles in household, the demographic groups most similar to Ugandans are Immigrants from Guatemala (88.9%, a difference of 0.0%), Argentinean (88.9%, a difference of 0.010%), Immigrants from Zaire (88.8%, a difference of 0.030%), Immigrants from Argentina (88.9%, a difference of 0.040%), and Peruvian (88.8%, a difference of 0.040%).
| Demographics | Rating | Rank | 1 or more Vehicles in Household |
| Sierra Leoneans | 13.0 /100 | #211 | Poor 89.0% |
| Somalis | 12.8 /100 | #212 | Poor 89.0% |
| Immigrants | Western Asia | 12.3 /100 | #213 | Poor 89.0% |
| Immigrants | Hungary | 11.9 /100 | #214 | Poor 89.0% |
| Immigrants | Sri Lanka | 10.2 /100 | #215 | Poor 88.9% |
| Immigrants | Argentina | 9.4 /100 | #216 | Tragic 88.9% |
| Argentineans | 8.8 /100 | #217 | Tragic 88.9% |
| Ugandans | 8.7 /100 | #218 | Tragic 88.9% |
| Immigrants | Guatemala | 8.6 /100 | #219 | Tragic 88.9% |
| Immigrants | Zaire | 8.1 /100 | #220 | Tragic 88.8% |
| Peruvians | 7.9 /100 | #221 | Tragic 88.8% |
| Uruguayans | 7.0 /100 | #222 | Tragic 88.8% |
| Immigrants | South America | 7.0 /100 | #223 | Tragic 88.8% |
| Immigrants | Hong Kong | 6.2 /100 | #224 | Tragic 88.7% |
| Cree | 6.0 /100 | #225 | Tragic 88.7% |
Demographics Similar to Yuman by 1 or more Vehicles in Household
In terms of 1 or more vehicles in household, the demographic groups most similar to Yuman are Immigrants from Russia (85.4%, a difference of 0.0%), Immigrants from Panama (85.4%, a difference of 0.050%), Moroccan (85.4%, a difference of 0.070%), Immigrants from Greece (85.4%, a difference of 0.10%), and Belizean (85.7%, a difference of 0.24%).
| Demographics | Rating | Rank | 1 or more Vehicles in Household |
| Okinawans | 0.0 /100 | #292 | Tragic 86.1% |
| Indians (Asian) | 0.0 /100 | #293 | Tragic 86.0% |
| Alaskan Athabascans | 0.0 /100 | #294 | Tragic 86.0% |
| Immigrants | Jamaica | 0.0 /100 | #295 | Tragic 85.8% |
| Immigrants | Spain | 0.0 /100 | #296 | Tragic 85.8% |
| Paraguayans | 0.0 /100 | #297 | Tragic 85.7% |
| Belizeans | 0.0 /100 | #298 | Tragic 85.7% |
| Yuman | 0.0 /100 | #299 | Tragic 85.5% |
| Immigrants | Russia | 0.0 /100 | #300 | Tragic 85.4% |
| Immigrants | Panama | 0.0 /100 | #301 | Tragic 85.4% |
| Moroccans | 0.0 /100 | #302 | Tragic 85.4% |
| Immigrants | Greece | 0.0 /100 | #303 | Tragic 85.4% |
| Immigrants | Ukraine | 0.0 /100 | #304 | Tragic 85.2% |
| Immigrants | China | 0.0 /100 | #305 | Tragic 84.9% |
| Immigrants | Western Africa | 0.0 /100 | #306 | Tragic 84.9% |