Immigrants from Uganda vs Pueblo 1 or more Vehicles in Household
COMPARE
Immigrants from Uganda
Pueblo
1 or more Vehicles in Household
1 or more Vehicles in Household Comparison
Immigrants from Uganda
Pueblo
90.1%
1 OR MORE VEHICLES IN HOUSEHOLD
73.8/ 100
METRIC RATING
154th/ 347
METRIC RANK
89.6%
1 OR MORE VEHICLES IN HOUSEHOLD
39.9/ 100
METRIC RATING
186th/ 347
METRIC RANK
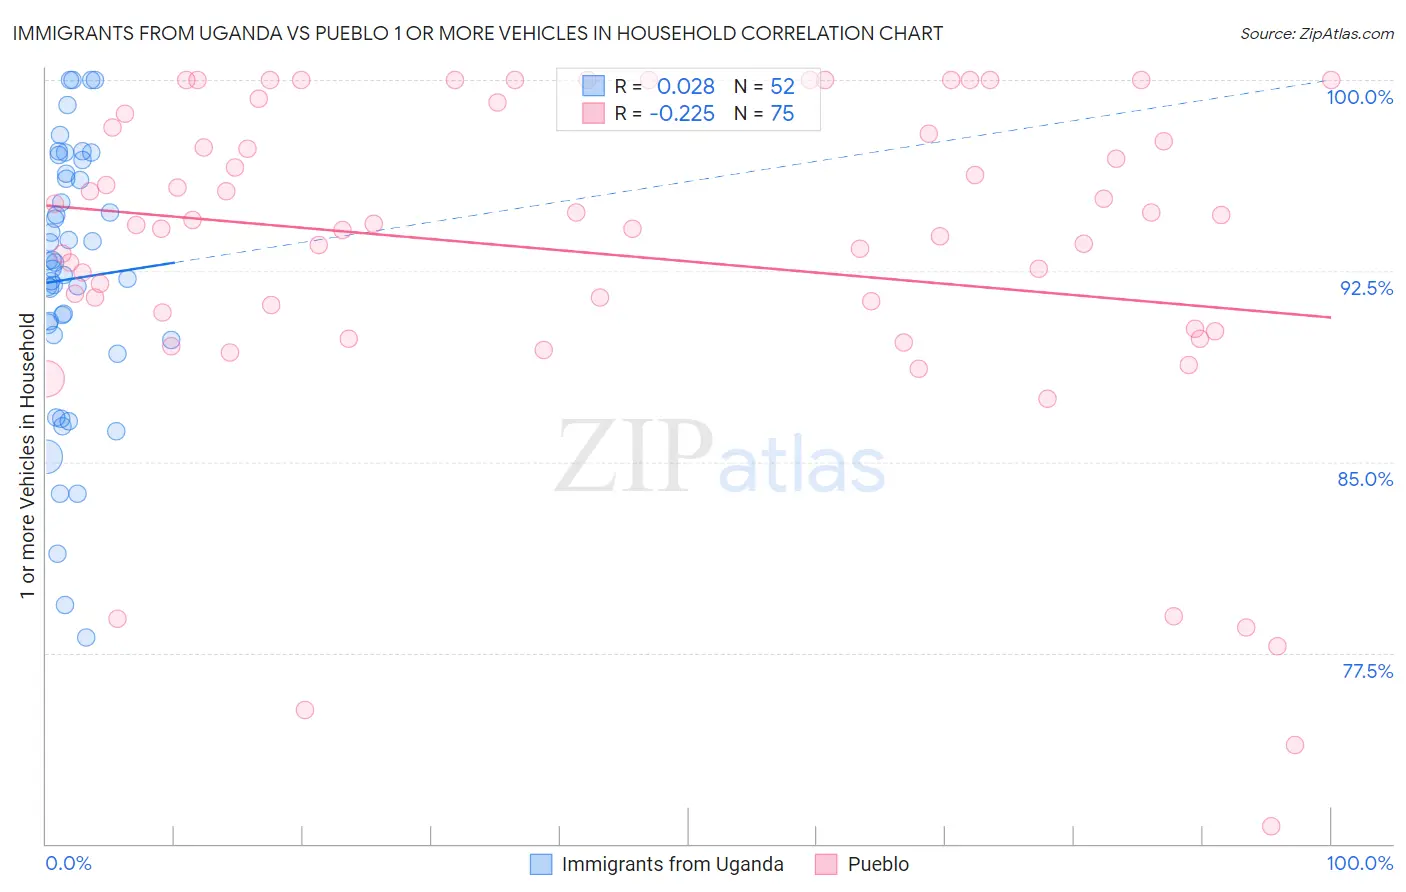
Immigrants from Uganda vs Pueblo 1 or more Vehicles in Household Correlation Chart
The statistical analysis conducted on geographies consisting of 125,961,827 people shows no correlation between the proportion of Immigrants from Uganda and percentage of households with 1 or more vehicles available in the United States with a correlation coefficient (R) of 0.028 and weighted average of 90.1%. Similarly, the statistical analysis conducted on geographies consisting of 120,072,520 people shows a weak negative correlation between the proportion of Pueblo and percentage of households with 1 or more vehicles available in the United States with a correlation coefficient (R) of -0.225 and weighted average of 89.6%, a difference of 0.56%.
1 or more Vehicles in Household Correlation Summary
| Measurement | Immigrants from Uganda | Pueblo |
| Minimum | 78.1% | 70.7% |
| Maximum | 100.0% | 100.0% |
| Range | 21.9% | 29.3% |
| Mean | 92.2% | 93.2% |
| Median | 92.7% | 94.3% |
| Interquartile 25% (IQ1) | 89.9% | 90.2% |
| Interquartile 75% (IQ3) | 96.2% | 98.2% |
| Interquartile Range (IQR) | 6.3% | 7.9% |
| Standard Deviation (Sample) | 5.3% | 6.6% |
| Standard Deviation (Population) | 5.2% | 6.6% |
Similar Demographics by 1 or more Vehicles in Household
Demographics Similar to Immigrants from Uganda by 1 or more Vehicles in Household
In terms of 1 or more vehicles in household, the demographic groups most similar to Immigrants from Uganda are New Zealander (90.1%, a difference of 0.0%), Immigrants (90.1%, a difference of 0.0%), Tlingit-Haida (90.1%, a difference of 0.010%), Immigrants from Bosnia and Herzegovina (90.1%, a difference of 0.030%), and Australian (90.0%, a difference of 0.030%).
| Demographics | Rating | Rank | 1 or more Vehicles in Household |
| Chileans | 79.8 /100 | #147 | Good 90.2% |
| Immigrants | Eastern Africa | 78.2 /100 | #148 | Good 90.1% |
| Immigrants | Nicaragua | 76.7 /100 | #149 | Good 90.1% |
| Immigrants | Micronesia | 75.9 /100 | #150 | Good 90.1% |
| Immigrants | Bosnia and Herzegovina | 75.4 /100 | #151 | Good 90.1% |
| Tlingit-Haida | 74.3 /100 | #152 | Good 90.1% |
| New Zealanders | 73.8 /100 | #153 | Good 90.1% |
| Immigrants | Uganda | 73.8 /100 | #154 | Good 90.1% |
| Immigrants | Immigrants | 73.6 /100 | #155 | Good 90.1% |
| Australians | 72.4 /100 | #156 | Good 90.0% |
| Immigrants | Congo | 71.2 /100 | #157 | Good 90.0% |
| Brazilians | 71.0 /100 | #158 | Good 90.0% |
| South Africans | 69.7 /100 | #159 | Good 90.0% |
| Immigrants | Indonesia | 68.8 /100 | #160 | Good 90.0% |
| Salvadorans | 68.7 /100 | #161 | Good 90.0% |
Demographics Similar to Pueblo by 1 or more Vehicles in Household
In terms of 1 or more vehicles in household, the demographic groups most similar to Pueblo are Immigrants from Brazil (89.6%, a difference of 0.0%), Immigrants from Bulgaria (89.6%, a difference of 0.010%), South American (89.5%, a difference of 0.010%), Ethiopian (89.6%, a difference of 0.020%), and Immigrants from Nepal (89.5%, a difference of 0.020%).
| Demographics | Rating | Rank | 1 or more Vehicles in Household |
| German Russians | 44.0 /100 | #179 | Average 89.6% |
| Arabs | 43.3 /100 | #180 | Average 89.6% |
| Immigrants | Ethiopia | 42.5 /100 | #181 | Average 89.6% |
| Ukrainians | 42.4 /100 | #182 | Average 89.6% |
| Ethiopians | 41.2 /100 | #183 | Average 89.6% |
| Immigrants | Bulgaria | 40.7 /100 | #184 | Average 89.6% |
| Immigrants | Brazil | 40.1 /100 | #185 | Average 89.6% |
| Pueblo | 39.9 /100 | #186 | Fair 89.6% |
| South Americans | 39.6 /100 | #187 | Fair 89.5% |
| Immigrants | Nepal | 38.9 /100 | #188 | Fair 89.5% |
| Carpatho Rusyns | 37.8 /100 | #189 | Fair 89.5% |
| Shoshone | 37.5 /100 | #190 | Fair 89.5% |
| Immigrants | Poland | 37.1 /100 | #191 | Fair 89.5% |
| Immigrants | North Macedonia | 36.5 /100 | #192 | Fair 89.5% |
| Immigrants | Northern Europe | 35.5 /100 | #193 | Fair 89.5% |