Immigrants from Uganda vs Indonesian 1 or more Vehicles in Household
COMPARE
Immigrants from Uganda
Indonesian
1 or more Vehicles in Household
1 or more Vehicles in Household Comparison
Immigrants from Uganda
Indonesians
90.1%
1 OR MORE VEHICLES IN HOUSEHOLD
73.8/ 100
METRIC RATING
154th/ 347
METRIC RANK
89.7%
1 OR MORE VEHICLES IN HOUSEHOLD
53.0/ 100
METRIC RATING
172nd/ 347
METRIC RANK
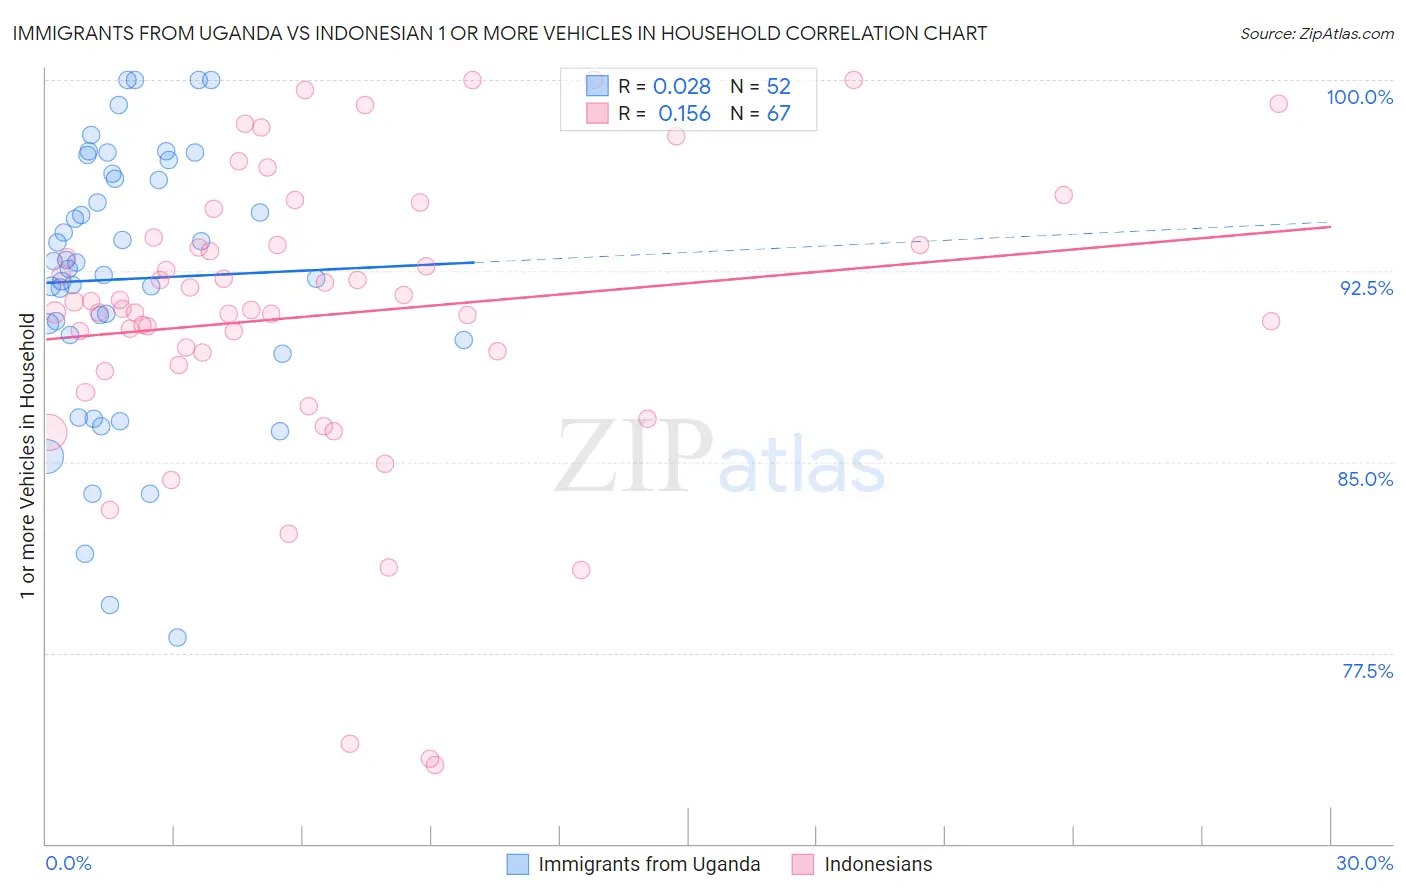
Immigrants from Uganda vs Indonesian 1 or more Vehicles in Household Correlation Chart
The statistical analysis conducted on geographies consisting of 125,961,827 people shows no correlation between the proportion of Immigrants from Uganda and percentage of households with 1 or more vehicles available in the United States with a correlation coefficient (R) of 0.028 and weighted average of 90.1%. Similarly, the statistical analysis conducted on geographies consisting of 162,633,112 people shows a poor positive correlation between the proportion of Indonesians and percentage of households with 1 or more vehicles available in the United States with a correlation coefficient (R) of 0.156 and weighted average of 89.7%, a difference of 0.36%.
1 or more Vehicles in Household Correlation Summary
| Measurement | Immigrants from Uganda | Indonesian |
| Minimum | 78.1% | 73.1% |
| Maximum | 100.0% | 100.0% |
| Range | 21.9% | 26.9% |
| Mean | 92.2% | 90.8% |
| Median | 92.7% | 91.0% |
| Interquartile 25% (IQ1) | 89.9% | 88.8% |
| Interquartile 75% (IQ3) | 96.2% | 93.5% |
| Interquartile Range (IQR) | 6.3% | 4.7% |
| Standard Deviation (Sample) | 5.3% | 5.9% |
| Standard Deviation (Population) | 5.2% | 5.8% |
Demographics Similar to Immigrants from Uganda and Indonesians by 1 or more Vehicles in Household
In terms of 1 or more vehicles in household, the demographic groups most similar to Immigrants from Uganda are New Zealander (90.1%, a difference of 0.0%), Immigrants (90.1%, a difference of 0.0%), Australian (90.0%, a difference of 0.030%), Immigrants from Congo (90.0%, a difference of 0.050%), and Brazilian (90.0%, a difference of 0.060%). Similarly, the demographic groups most similar to Indonesians are Lumbee (89.7%, a difference of 0.0%), French American Indian (89.8%, a difference of 0.020%), Immigrants from Costa Rica (89.8%, a difference of 0.070%), Native/Alaskan (89.8%, a difference of 0.10%), and Immigrants from Cambodia (89.8%, a difference of 0.11%).
| Demographics | Rating | Rank | 1 or more Vehicles in Household |
| New Zealanders | 73.8 /100 | #153 | Good 90.1% |
| Immigrants | Uganda | 73.8 /100 | #154 | Good 90.1% |
| Immigrants | Immigrants | 73.6 /100 | #155 | Good 90.1% |
| Australians | 72.4 /100 | #156 | Good 90.0% |
| Immigrants | Congo | 71.2 /100 | #157 | Good 90.0% |
| Brazilians | 71.0 /100 | #158 | Good 90.0% |
| South Africans | 69.7 /100 | #159 | Good 90.0% |
| Immigrants | Indonesia | 68.8 /100 | #160 | Good 90.0% |
| Salvadorans | 68.7 /100 | #161 | Good 90.0% |
| Spanish American Indians | 67.0 /100 | #162 | Good 89.9% |
| Immigrants | Austria | 65.5 /100 | #163 | Good 89.9% |
| Comanche | 63.4 /100 | #164 | Good 89.9% |
| Immigrants | Saudi Arabia | 62.6 /100 | #165 | Good 89.9% |
| Immigrants | Middle Africa | 62.2 /100 | #166 | Good 89.9% |
| Immigrants | Latin America | 60.3 /100 | #167 | Good 89.8% |
| Immigrants | Cambodia | 60.1 /100 | #168 | Good 89.8% |
| Natives/Alaskans | 59.5 /100 | #169 | Average 89.8% |
| Immigrants | Costa Rica | 57.6 /100 | #170 | Average 89.8% |
| French American Indians | 54.4 /100 | #171 | Average 89.8% |
| Indonesians | 53.0 /100 | #172 | Average 89.7% |
| Lumbee | 52.8 /100 | #173 | Average 89.7% |