Basque vs Yuman 1 or more Vehicles in Household
COMPARE
Basque
Yuman
1 or more Vehicles in Household
1 or more Vehicles in Household Comparison
Basques
Yuman
92.4%
1 OR MORE VEHICLES IN HOUSEHOLD
100.0/ 100
METRIC RATING
32nd/ 347
METRIC RANK
85.5%
1 OR MORE VEHICLES IN HOUSEHOLD
0.0/ 100
METRIC RATING
299th/ 347
METRIC RANK
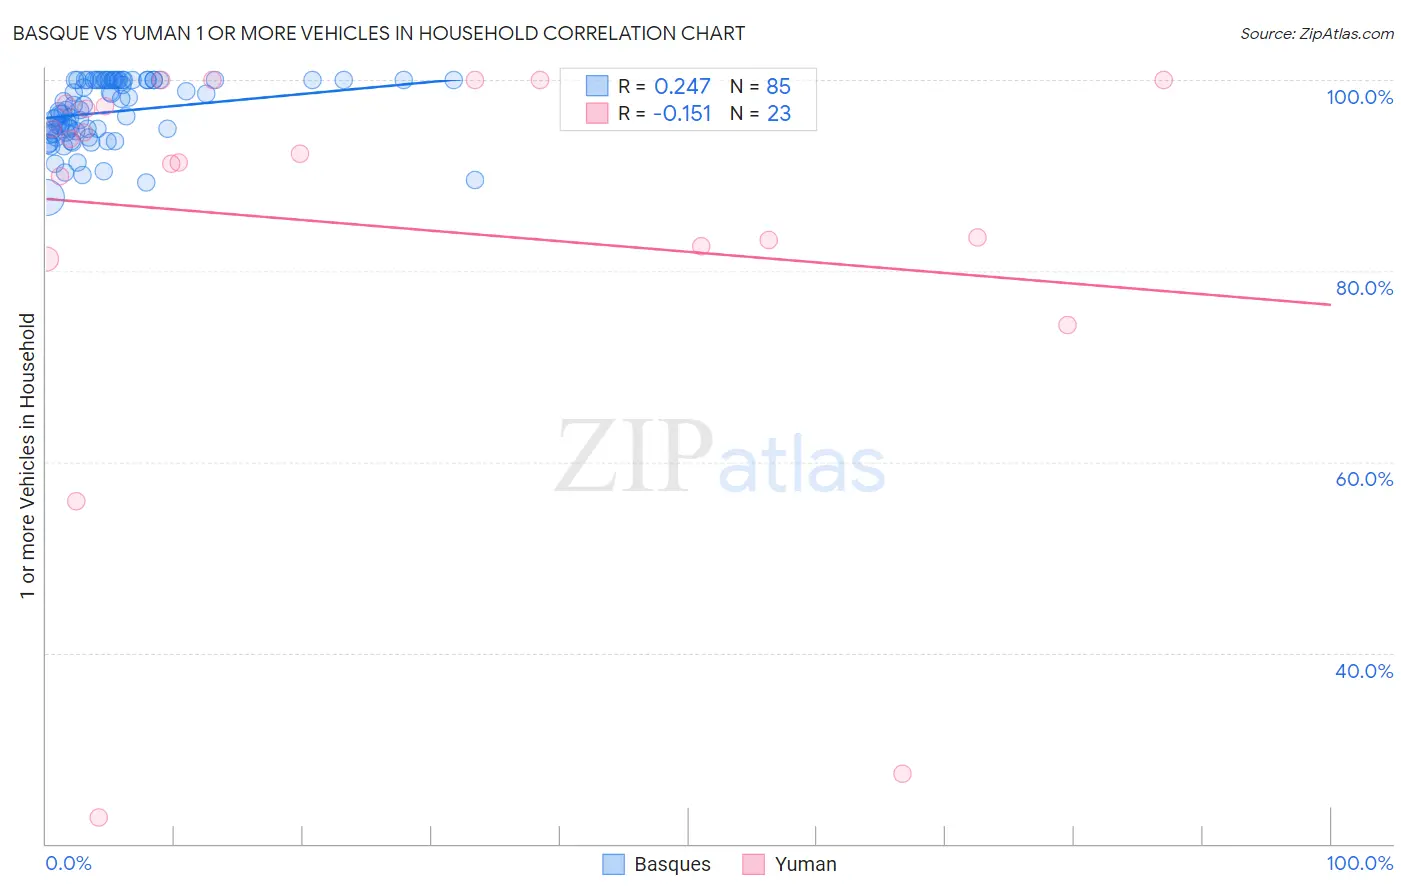
Basque vs Yuman 1 or more Vehicles in Household Correlation Chart
The statistical analysis conducted on geographies consisting of 165,757,280 people shows a weak positive correlation between the proportion of Basques and percentage of households with 1 or more vehicles available in the United States with a correlation coefficient (R) of 0.247 and weighted average of 92.4%. Similarly, the statistical analysis conducted on geographies consisting of 40,663,643 people shows a poor negative correlation between the proportion of Yuman and percentage of households with 1 or more vehicles available in the United States with a correlation coefficient (R) of -0.151 and weighted average of 85.5%, a difference of 8.1%.
1 or more Vehicles in Household Correlation Summary
| Measurement | Basque | Yuman |
| Minimum | 87.7% | 22.7% |
| Maximum | 100.0% | 100.0% |
| Range | 12.3% | 77.3% |
| Mean | 96.7% | 84.8% |
| Median | 96.8% | 92.3% |
| Interquartile 25% (IQ1) | 94.5% | 82.6% |
| Interquartile 75% (IQ3) | 100.0% | 97.5% |
| Interquartile Range (IQR) | 5.5% | 14.8% |
| Standard Deviation (Sample) | 3.3% | 21.5% |
| Standard Deviation (Population) | 3.2% | 21.1% |
Similar Demographics by 1 or more Vehicles in Household
Demographics Similar to Basques by 1 or more Vehicles in Household
In terms of 1 or more vehicles in household, the demographic groups most similar to Basques are Cherokee (92.4%, a difference of 0.010%), Samoan (92.4%, a difference of 0.040%), Native Hawaiian (92.4%, a difference of 0.050%), Finnish (92.4%, a difference of 0.050%), and Sri Lankan (92.5%, a difference of 0.070%).
| Demographics | Rating | Rank | 1 or more Vehicles in Household |
| Immigrants | Iraq | 100.0 /100 | #25 | Exceptional 92.5% |
| British | 100.0 /100 | #26 | Exceptional 92.5% |
| Americans | 100.0 /100 | #27 | Exceptional 92.5% |
| Sri Lankans | 100.0 /100 | #28 | Exceptional 92.5% |
| Native Hawaiians | 100.0 /100 | #29 | Exceptional 92.4% |
| Finns | 100.0 /100 | #30 | Exceptional 92.4% |
| Samoans | 100.0 /100 | #31 | Exceptional 92.4% |
| Basques | 100.0 /100 | #32 | Exceptional 92.4% |
| Cherokee | 100.0 /100 | #33 | Exceptional 92.4% |
| Italians | 99.9 /100 | #34 | Exceptional 92.3% |
| Czechoslovakians | 99.9 /100 | #35 | Exceptional 92.3% |
| Malaysians | 99.9 /100 | #36 | Exceptional 92.3% |
| French Canadians | 99.9 /100 | #37 | Exceptional 92.3% |
| Immigrants | Vietnam | 99.9 /100 | #38 | Exceptional 92.3% |
| Swiss | 99.9 /100 | #39 | Exceptional 92.3% |
Demographics Similar to Yuman by 1 or more Vehicles in Household
In terms of 1 or more vehicles in household, the demographic groups most similar to Yuman are Immigrants from Russia (85.4%, a difference of 0.0%), Immigrants from Panama (85.4%, a difference of 0.050%), Moroccan (85.4%, a difference of 0.070%), Immigrants from Greece (85.4%, a difference of 0.10%), and Belizean (85.7%, a difference of 0.24%).
| Demographics | Rating | Rank | 1 or more Vehicles in Household |
| Okinawans | 0.0 /100 | #292 | Tragic 86.1% |
| Indians (Asian) | 0.0 /100 | #293 | Tragic 86.0% |
| Alaskan Athabascans | 0.0 /100 | #294 | Tragic 86.0% |
| Immigrants | Jamaica | 0.0 /100 | #295 | Tragic 85.8% |
| Immigrants | Spain | 0.0 /100 | #296 | Tragic 85.8% |
| Paraguayans | 0.0 /100 | #297 | Tragic 85.7% |
| Belizeans | 0.0 /100 | #298 | Tragic 85.7% |
| Yuman | 0.0 /100 | #299 | Tragic 85.5% |
| Immigrants | Russia | 0.0 /100 | #300 | Tragic 85.4% |
| Immigrants | Panama | 0.0 /100 | #301 | Tragic 85.4% |
| Moroccans | 0.0 /100 | #302 | Tragic 85.4% |
| Immigrants | Greece | 0.0 /100 | #303 | Tragic 85.4% |
| Immigrants | Ukraine | 0.0 /100 | #304 | Tragic 85.2% |
| Immigrants | China | 0.0 /100 | #305 | Tragic 84.9% |
| Immigrants | Western Africa | 0.0 /100 | #306 | Tragic 84.9% |