Immigrants from Uganda vs Yup'ik 1 or more Vehicles in Household
COMPARE
Immigrants from Uganda
Yup'ik
1 or more Vehicles in Household
1 or more Vehicles in Household Comparison
Immigrants from Uganda
Yup'ik
90.1%
1 OR MORE VEHICLES IN HOUSEHOLD
73.8/ 100
METRIC RATING
154th/ 347
METRIC RANK
58.4%
1 OR MORE VEHICLES IN HOUSEHOLD
0.0/ 100
METRIC RATING
347th/ 347
METRIC RANK
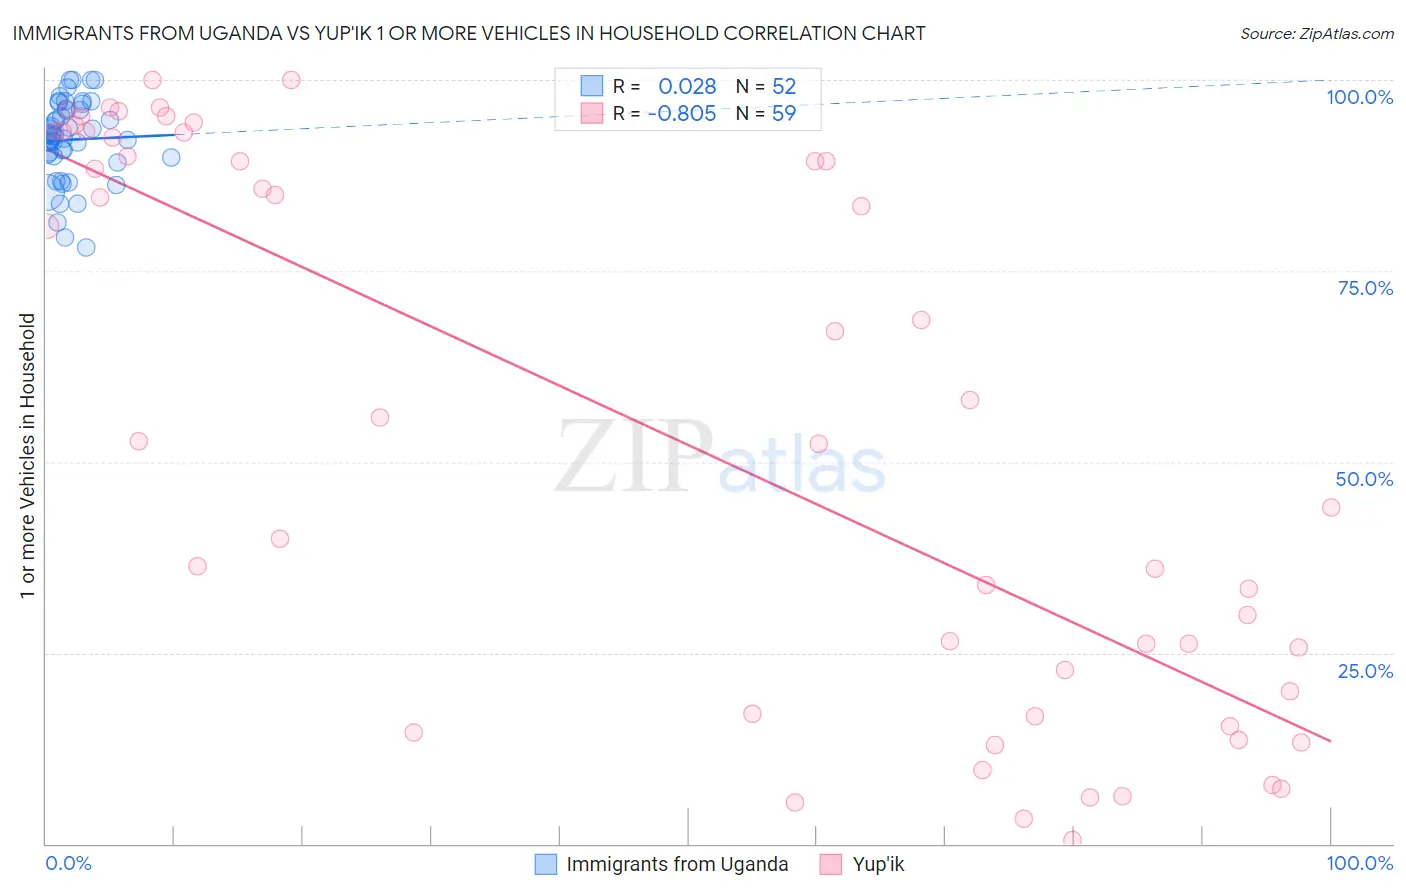
Immigrants from Uganda vs Yup'ik 1 or more Vehicles in Household Correlation Chart
The statistical analysis conducted on geographies consisting of 125,961,827 people shows no correlation between the proportion of Immigrants from Uganda and percentage of households with 1 or more vehicles available in the United States with a correlation coefficient (R) of 0.028 and weighted average of 90.1%. Similarly, the statistical analysis conducted on geographies consisting of 39,949,066 people shows a very strong negative correlation between the proportion of Yup'ik and percentage of households with 1 or more vehicles available in the United States with a correlation coefficient (R) of -0.805 and weighted average of 58.4%, a difference of 54.1%.
1 or more Vehicles in Household Correlation Summary
| Measurement | Immigrants from Uganda | Yup'ik |
| Minimum | 78.1% | 0.41% |
| Maximum | 100.0% | 100.0% |
| Range | 21.9% | 99.6% |
| Mean | 92.2% | 54.2% |
| Median | 92.7% | 52.7% |
| Interquartile 25% (IQ1) | 89.9% | 17.0% |
| Interquartile 75% (IQ3) | 96.2% | 92.4% |
| Interquartile Range (IQR) | 6.3% | 75.4% |
| Standard Deviation (Sample) | 5.3% | 35.7% |
| Standard Deviation (Population) | 5.2% | 35.4% |
Similar Demographics by 1 or more Vehicles in Household
Demographics Similar to Immigrants from Uganda by 1 or more Vehicles in Household
In terms of 1 or more vehicles in household, the demographic groups most similar to Immigrants from Uganda are New Zealander (90.1%, a difference of 0.0%), Immigrants (90.1%, a difference of 0.0%), Tlingit-Haida (90.1%, a difference of 0.010%), Immigrants from Bosnia and Herzegovina (90.1%, a difference of 0.030%), and Australian (90.0%, a difference of 0.030%).
| Demographics | Rating | Rank | 1 or more Vehicles in Household |
| Chileans | 79.8 /100 | #147 | Good 90.2% |
| Immigrants | Eastern Africa | 78.2 /100 | #148 | Good 90.1% |
| Immigrants | Nicaragua | 76.7 /100 | #149 | Good 90.1% |
| Immigrants | Micronesia | 75.9 /100 | #150 | Good 90.1% |
| Immigrants | Bosnia and Herzegovina | 75.4 /100 | #151 | Good 90.1% |
| Tlingit-Haida | 74.3 /100 | #152 | Good 90.1% |
| New Zealanders | 73.8 /100 | #153 | Good 90.1% |
| Immigrants | Uganda | 73.8 /100 | #154 | Good 90.1% |
| Immigrants | Immigrants | 73.6 /100 | #155 | Good 90.1% |
| Australians | 72.4 /100 | #156 | Good 90.0% |
| Immigrants | Congo | 71.2 /100 | #157 | Good 90.0% |
| Brazilians | 71.0 /100 | #158 | Good 90.0% |
| South Africans | 69.7 /100 | #159 | Good 90.0% |
| Immigrants | Indonesia | 68.8 /100 | #160 | Good 90.0% |
| Salvadorans | 68.7 /100 | #161 | Good 90.0% |
Demographics Similar to Yup'ik by 1 or more Vehicles in Household
In terms of 1 or more vehicles in household, the demographic groups most similar to Yup'ik are Immigrants from Grenada (62.7%, a difference of 7.2%), Immigrants from St. Vincent and the Grenadines (64.7%, a difference of 10.7%), Immigrants from Dominican Republic (68.6%, a difference of 17.4%), British West Indian (70.4%, a difference of 20.4%), and Immigrants from Guyana (70.6%, a difference of 20.7%).
| Demographics | Rating | Rank | 1 or more Vehicles in Household |
| Immigrants | Ecuador | 0.0 /100 | #333 | Tragic 76.2% |
| Immigrants | Bangladesh | 0.0 /100 | #334 | Tragic 74.3% |
| Barbadians | 0.0 /100 | #335 | Tragic 74.0% |
| Vietnamese | 0.0 /100 | #336 | Tragic 73.8% |
| Immigrants | Uzbekistan | 0.0 /100 | #337 | Tragic 73.4% |
| Inupiat | 0.0 /100 | #338 | Tragic 71.5% |
| Guyanese | 0.0 /100 | #339 | Tragic 70.8% |
| Dominicans | 0.0 /100 | #340 | Tragic 70.7% |
| Immigrants | Barbados | 0.0 /100 | #341 | Tragic 70.6% |
| Immigrants | Guyana | 0.0 /100 | #342 | Tragic 70.6% |
| British West Indians | 0.0 /100 | #343 | Tragic 70.4% |
| Immigrants | Dominican Republic | 0.0 /100 | #344 | Tragic 68.6% |
| Immigrants | St. Vincent and the Grenadines | 0.0 /100 | #345 | Tragic 64.7% |
| Immigrants | Grenada | 0.0 /100 | #346 | Tragic 62.7% |
| Yup'ik | 0.0 /100 | #347 | Tragic 58.4% |