Immigrants from Uganda vs Hmong 1 or more Vehicles in Household
COMPARE
Immigrants from Uganda
Hmong
1 or more Vehicles in Household
1 or more Vehicles in Household Comparison
Immigrants from Uganda
Hmong
90.1%
1 OR MORE VEHICLES IN HOUSEHOLD
73.8/ 100
METRIC RATING
154th/ 347
METRIC RANK
89.6%
1 OR MORE VEHICLES IN HOUSEHOLD
45.8/ 100
METRIC RATING
177th/ 347
METRIC RANK
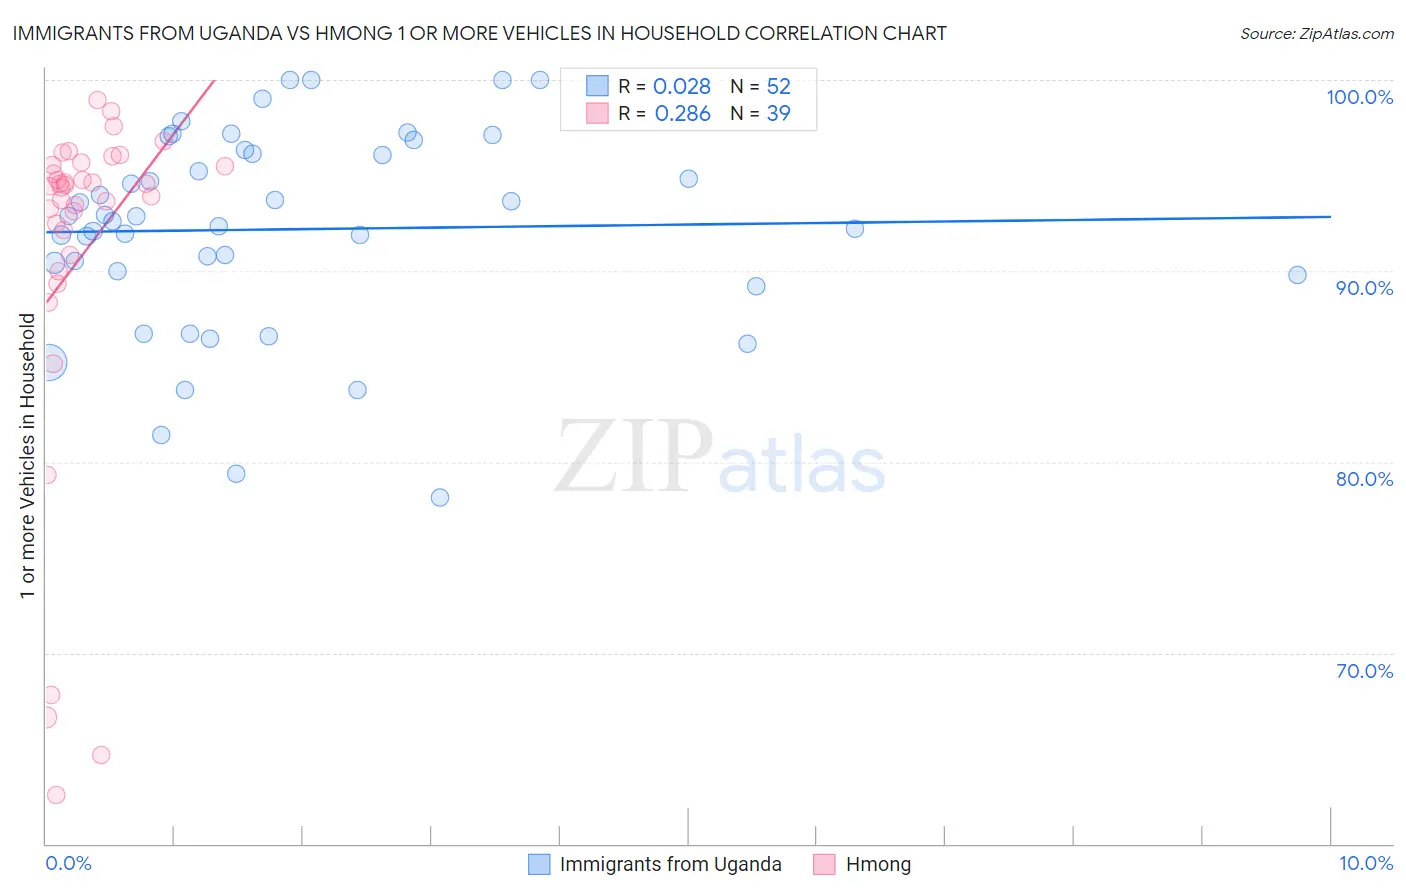
Immigrants from Uganda vs Hmong 1 or more Vehicles in Household Correlation Chart
The statistical analysis conducted on geographies consisting of 125,961,827 people shows no correlation between the proportion of Immigrants from Uganda and percentage of households with 1 or more vehicles available in the United States with a correlation coefficient (R) of 0.028 and weighted average of 90.1%. Similarly, the statistical analysis conducted on geographies consisting of 24,678,157 people shows a weak positive correlation between the proportion of Hmong and percentage of households with 1 or more vehicles available in the United States with a correlation coefficient (R) of 0.286 and weighted average of 89.6%, a difference of 0.47%.
1 or more Vehicles in Household Correlation Summary
| Measurement | Immigrants from Uganda | Hmong |
| Minimum | 78.1% | 62.6% |
| Maximum | 100.0% | 99.0% |
| Range | 21.9% | 36.4% |
| Mean | 92.2% | 90.8% |
| Median | 92.7% | 94.5% |
| Interquartile 25% (IQ1) | 89.9% | 90.8% |
| Interquartile 75% (IQ3) | 96.2% | 95.5% |
| Interquartile Range (IQR) | 6.3% | 4.7% |
| Standard Deviation (Sample) | 5.3% | 9.4% |
| Standard Deviation (Population) | 5.2% | 9.3% |
Similar Demographics by 1 or more Vehicles in Household
Demographics Similar to Immigrants from Uganda by 1 or more Vehicles in Household
In terms of 1 or more vehicles in household, the demographic groups most similar to Immigrants from Uganda are New Zealander (90.1%, a difference of 0.0%), Immigrants (90.1%, a difference of 0.0%), Tlingit-Haida (90.1%, a difference of 0.010%), Immigrants from Bosnia and Herzegovina (90.1%, a difference of 0.030%), and Australian (90.0%, a difference of 0.030%).
| Demographics | Rating | Rank | 1 or more Vehicles in Household |
| Chileans | 79.8 /100 | #147 | Good 90.2% |
| Immigrants | Eastern Africa | 78.2 /100 | #148 | Good 90.1% |
| Immigrants | Nicaragua | 76.7 /100 | #149 | Good 90.1% |
| Immigrants | Micronesia | 75.9 /100 | #150 | Good 90.1% |
| Immigrants | Bosnia and Herzegovina | 75.4 /100 | #151 | Good 90.1% |
| Tlingit-Haida | 74.3 /100 | #152 | Good 90.1% |
| New Zealanders | 73.8 /100 | #153 | Good 90.1% |
| Immigrants | Uganda | 73.8 /100 | #154 | Good 90.1% |
| Immigrants | Immigrants | 73.6 /100 | #155 | Good 90.1% |
| Australians | 72.4 /100 | #156 | Good 90.0% |
| Immigrants | Congo | 71.2 /100 | #157 | Good 90.0% |
| Brazilians | 71.0 /100 | #158 | Good 90.0% |
| South Africans | 69.7 /100 | #159 | Good 90.0% |
| Immigrants | Indonesia | 68.8 /100 | #160 | Good 90.0% |
| Salvadorans | 68.7 /100 | #161 | Good 90.0% |
Demographics Similar to Hmong by 1 or more Vehicles in Household
In terms of 1 or more vehicles in household, the demographic groups most similar to Hmong are Immigrants from Sudan (89.7%, a difference of 0.020%), Immigrants from Burma/Myanmar (89.7%, a difference of 0.030%), Immigrants from El Salvador (89.6%, a difference of 0.030%), German Russian (89.6%, a difference of 0.030%), and Arab (89.6%, a difference of 0.040%).
| Demographics | Rating | Rank | 1 or more Vehicles in Household |
| Immigrants | Costa Rica | 57.6 /100 | #170 | Average 89.8% |
| French American Indians | 54.4 /100 | #171 | Average 89.8% |
| Indonesians | 53.0 /100 | #172 | Average 89.7% |
| Lumbee | 52.8 /100 | #173 | Average 89.7% |
| Filipinos | 50.0 /100 | #174 | Average 89.7% |
| Immigrants | Burma/Myanmar | 47.6 /100 | #175 | Average 89.7% |
| Immigrants | Sudan | 47.1 /100 | #176 | Average 89.7% |
| Hmong | 45.8 /100 | #177 | Average 89.6% |
| Immigrants | El Salvador | 44.1 /100 | #178 | Average 89.6% |
| German Russians | 44.0 /100 | #179 | Average 89.6% |
| Arabs | 43.3 /100 | #180 | Average 89.6% |
| Immigrants | Ethiopia | 42.5 /100 | #181 | Average 89.6% |
| Ukrainians | 42.4 /100 | #182 | Average 89.6% |
| Ethiopians | 41.2 /100 | #183 | Average 89.6% |
| Immigrants | Bulgaria | 40.7 /100 | #184 | Average 89.6% |