Immigrants from Uganda vs Czechoslovakian 1 or more Vehicles in Household
COMPARE
Immigrants from Uganda
Czechoslovakian
1 or more Vehicles in Household
1 or more Vehicles in Household Comparison
Immigrants from Uganda
Czechoslovakians
90.1%
1 OR MORE VEHICLES IN HOUSEHOLD
73.8/ 100
METRIC RATING
154th/ 347
METRIC RANK
92.3%
1 OR MORE VEHICLES IN HOUSEHOLD
99.9/ 100
METRIC RATING
35th/ 347
METRIC RANK
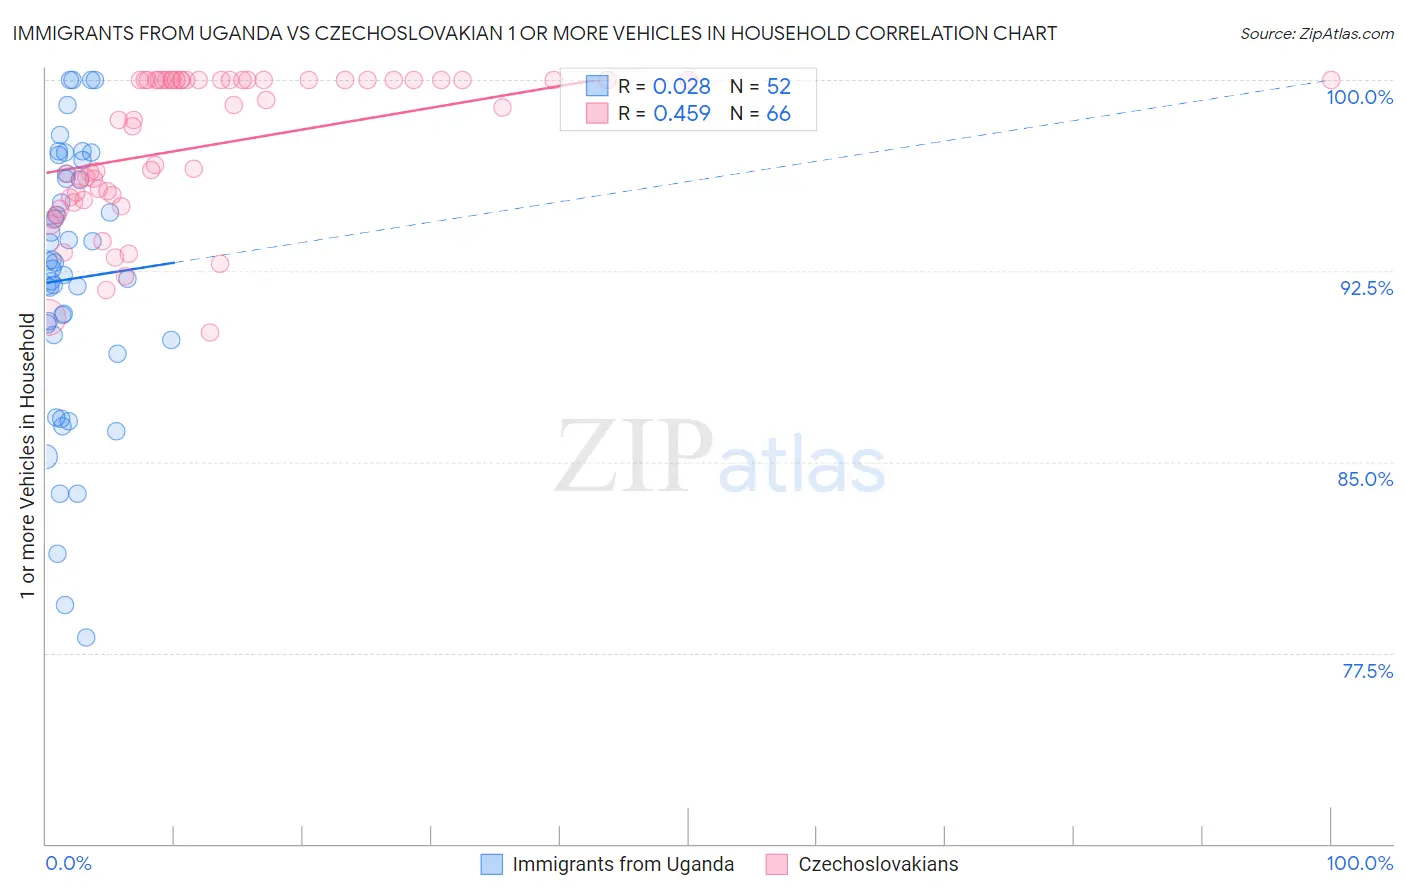
Immigrants from Uganda vs Czechoslovakian 1 or more Vehicles in Household Correlation Chart
The statistical analysis conducted on geographies consisting of 125,961,827 people shows no correlation between the proportion of Immigrants from Uganda and percentage of households with 1 or more vehicles available in the United States with a correlation coefficient (R) of 0.028 and weighted average of 90.1%. Similarly, the statistical analysis conducted on geographies consisting of 368,548,563 people shows a moderate positive correlation between the proportion of Czechoslovakians and percentage of households with 1 or more vehicles available in the United States with a correlation coefficient (R) of 0.459 and weighted average of 92.3%, a difference of 2.5%.
1 or more Vehicles in Household Correlation Summary
| Measurement | Immigrants from Uganda | Czechoslovakian |
| Minimum | 78.1% | 90.1% |
| Maximum | 100.0% | 100.0% |
| Range | 21.9% | 9.9% |
| Mean | 92.2% | 97.5% |
| Median | 92.7% | 98.7% |
| Interquartile 25% (IQ1) | 89.9% | 95.4% |
| Interquartile 75% (IQ3) | 96.2% | 100.0% |
| Interquartile Range (IQR) | 6.3% | 4.6% |
| Standard Deviation (Sample) | 5.3% | 2.9% |
| Standard Deviation (Population) | 5.2% | 2.8% |
Similar Demographics by 1 or more Vehicles in Household
Demographics Similar to Immigrants from Uganda by 1 or more Vehicles in Household
In terms of 1 or more vehicles in household, the demographic groups most similar to Immigrants from Uganda are New Zealander (90.1%, a difference of 0.0%), Immigrants (90.1%, a difference of 0.0%), Tlingit-Haida (90.1%, a difference of 0.010%), Immigrants from Bosnia and Herzegovina (90.1%, a difference of 0.030%), and Australian (90.0%, a difference of 0.030%).
| Demographics | Rating | Rank | 1 or more Vehicles in Household |
| Chileans | 79.8 /100 | #147 | Good 90.2% |
| Immigrants | Eastern Africa | 78.2 /100 | #148 | Good 90.1% |
| Immigrants | Nicaragua | 76.7 /100 | #149 | Good 90.1% |
| Immigrants | Micronesia | 75.9 /100 | #150 | Good 90.1% |
| Immigrants | Bosnia and Herzegovina | 75.4 /100 | #151 | Good 90.1% |
| Tlingit-Haida | 74.3 /100 | #152 | Good 90.1% |
| New Zealanders | 73.8 /100 | #153 | Good 90.1% |
| Immigrants | Uganda | 73.8 /100 | #154 | Good 90.1% |
| Immigrants | Immigrants | 73.6 /100 | #155 | Good 90.1% |
| Australians | 72.4 /100 | #156 | Good 90.0% |
| Immigrants | Congo | 71.2 /100 | #157 | Good 90.0% |
| Brazilians | 71.0 /100 | #158 | Good 90.0% |
| South Africans | 69.7 /100 | #159 | Good 90.0% |
| Immigrants | Indonesia | 68.8 /100 | #160 | Good 90.0% |
| Salvadorans | 68.7 /100 | #161 | Good 90.0% |
Demographics Similar to Czechoslovakians by 1 or more Vehicles in Household
In terms of 1 or more vehicles in household, the demographic groups most similar to Czechoslovakians are Malaysian (92.3%, a difference of 0.0%), Italian (92.3%, a difference of 0.010%), French Canadian (92.3%, a difference of 0.010%), Immigrants from Vietnam (92.3%, a difference of 0.020%), and Swiss (92.3%, a difference of 0.020%).
| Demographics | Rating | Rank | 1 or more Vehicles in Household |
| Sri Lankans | 100.0 /100 | #28 | Exceptional 92.5% |
| Native Hawaiians | 100.0 /100 | #29 | Exceptional 92.4% |
| Finns | 100.0 /100 | #30 | Exceptional 92.4% |
| Samoans | 100.0 /100 | #31 | Exceptional 92.4% |
| Basques | 100.0 /100 | #32 | Exceptional 92.4% |
| Cherokee | 100.0 /100 | #33 | Exceptional 92.4% |
| Italians | 99.9 /100 | #34 | Exceptional 92.3% |
| Czechoslovakians | 99.9 /100 | #35 | Exceptional 92.3% |
| Malaysians | 99.9 /100 | #36 | Exceptional 92.3% |
| French Canadians | 99.9 /100 | #37 | Exceptional 92.3% |
| Immigrants | Vietnam | 99.9 /100 | #38 | Exceptional 92.3% |
| Swiss | 99.9 /100 | #39 | Exceptional 92.3% |
| Creek | 99.9 /100 | #40 | Exceptional 92.3% |
| Immigrants | Taiwan | 99.9 /100 | #41 | Exceptional 92.3% |
| Chickasaw | 99.9 /100 | #42 | Exceptional 92.3% |