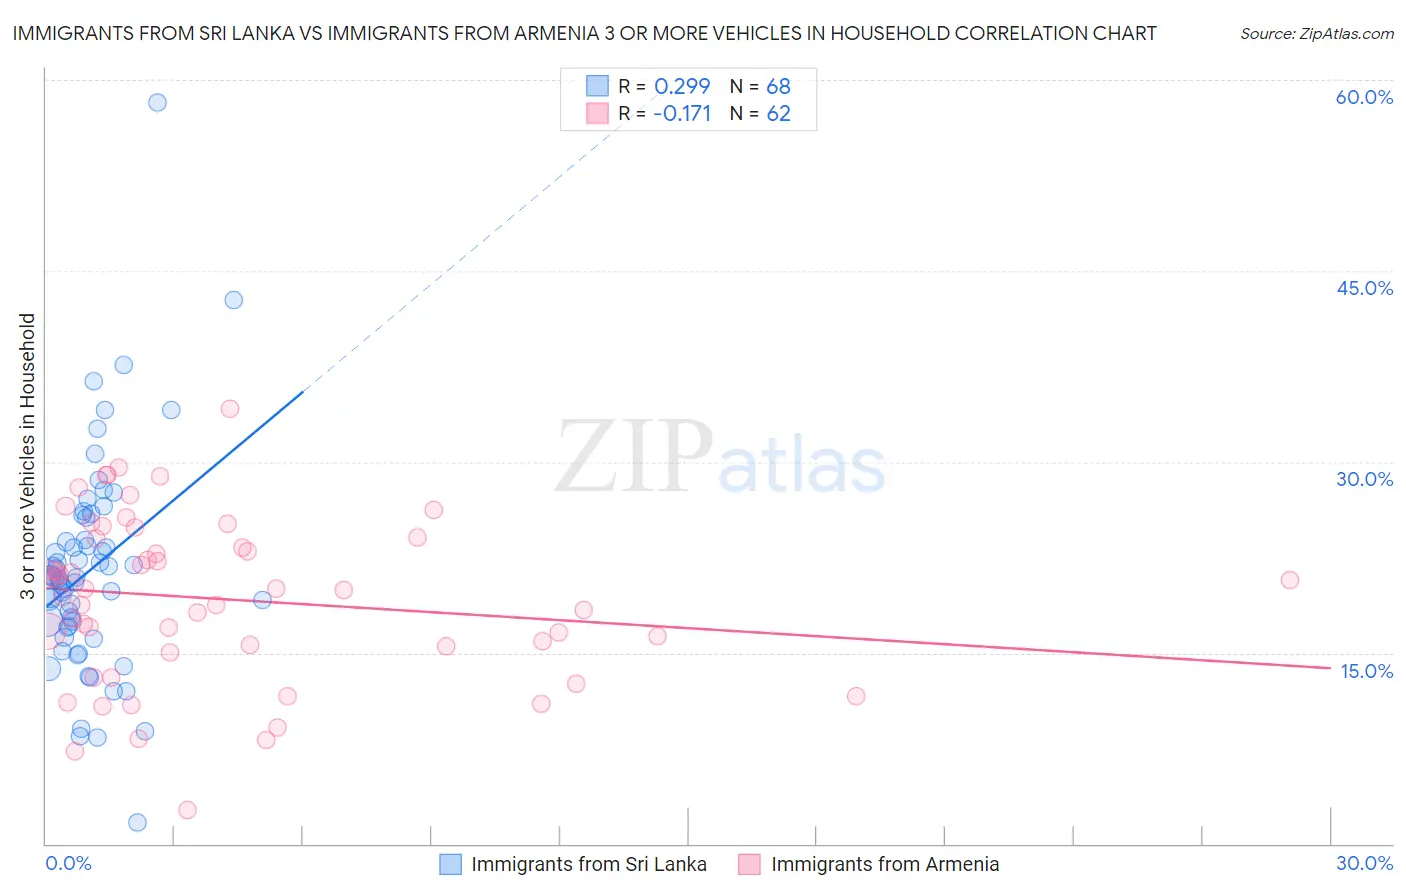
Immigrants from Sri Lanka vs Immigrants from Armenia 3 or more Vehicles in Household
COMPARE
Immigrants from Sri Lanka
Immigrants from Armenia
3 or more Vehicles in Household
3 or more Vehicles in Household Comparison
Immigrants from Sri Lanka
Immigrants from Armenia
19.2%
3 OR MORE VEHICLES IN HOUSEHOLD
30.7/ 100
METRIC RATING
185th/ 347
METRIC RANK
18.6%
3 OR MORE VEHICLES IN HOUSEHOLD
8.6/ 100
METRIC RATING
219th/ 347
METRIC RANK
Immigrants from Sri Lanka vs Immigrants from Armenia 3 or more Vehicles in Household Correlation Chart
The statistical analysis conducted on geographies consisting of 149,676,246 people shows a weak positive correlation between the proportion of Immigrants from Sri Lanka and percentage of households with 3 or more vehicles available in the United States with a correlation coefficient (R) of 0.299 and weighted average of 19.2%. Similarly, the statistical analysis conducted on geographies consisting of 97,705,679 people shows a poor negative correlation between the proportion of Immigrants from Armenia and percentage of households with 3 or more vehicles available in the United States with a correlation coefficient (R) of -0.171 and weighted average of 18.6%, a difference of 3.1%.
3 or more Vehicles in Household Correlation Summary
| Measurement | Immigrants from Sri Lanka | Immigrants from Armenia |
| Minimum | 1.7% | 2.7% |
| Maximum | 58.3% | 34.1% |
| Range | 56.6% | 31.5% |
| Mean | 21.5% | 19.2% |
| Median | 20.9% | 19.9% |
| Interquartile 25% (IQ1) | 17.0% | 15.5% |
| Interquartile 75% (IQ3) | 24.8% | 23.9% |
| Interquartile Range (IQR) | 7.7% | 8.5% |
| Standard Deviation (Sample) | 8.6% | 6.5% |
| Standard Deviation (Population) | 8.5% | 6.4% |
Similar Demographics by 3 or more Vehicles in Household
Demographics Similar to Immigrants from Sri Lanka by 3 or more Vehicles in Household
In terms of 3 or more vehicles in household, the demographic groups most similar to Immigrants from Sri Lanka are Immigrants from Sweden (19.2%, a difference of 0.16%), Immigrants from Hong Kong (19.2%, a difference of 0.22%), Latvian (19.3%, a difference of 0.44%), Immigrants from Kuwait (19.1%, a difference of 0.44%), and Indian (Asian) (19.1%, a difference of 0.44%).
| Demographics | Rating | Rank | 3 or more Vehicles in Household |
| Immigrants | Syria | 40.3 /100 | #178 | Average 19.4% |
| Immigrants | South Central Asia | 38.9 /100 | #179 | Fair 19.3% |
| South Africans | 37.5 /100 | #180 | Fair 19.3% |
| Romanians | 37.1 /100 | #181 | Fair 19.3% |
| Cubans | 36.6 /100 | #182 | Fair 19.3% |
| Cajuns | 36.0 /100 | #183 | Fair 19.3% |
| Latvians | 35.7 /100 | #184 | Fair 19.3% |
| Immigrants | Sri Lanka | 30.7 /100 | #185 | Fair 19.2% |
| Immigrants | Sweden | 29.0 /100 | #186 | Fair 19.2% |
| Immigrants | Hong Kong | 28.3 /100 | #187 | Fair 19.2% |
| Immigrants | Kuwait | 26.1 /100 | #188 | Fair 19.1% |
| Indians (Asian) | 26.0 /100 | #189 | Fair 19.1% |
| Immigrants | Zimbabwe | 25.5 /100 | #190 | Fair 19.1% |
| South American Indians | 25.4 /100 | #191 | Fair 19.1% |
| Kenyans | 24.7 /100 | #192 | Fair 19.1% |
Demographics Similar to Immigrants from Armenia by 3 or more Vehicles in Household
In terms of 3 or more vehicles in household, the demographic groups most similar to Immigrants from Armenia are Immigrants from Portugal (18.6%, a difference of 0.080%), Nigerian (18.6%, a difference of 0.20%), Immigrants from Poland (18.6%, a difference of 0.29%), Belizean (18.6%, a difference of 0.34%), and Immigrants from Italy (18.7%, a difference of 0.38%).
| Demographics | Rating | Rank | 3 or more Vehicles in Household |
| Panamanians | 11.6 /100 | #212 | Poor 18.8% |
| Immigrants | Cuba | 11.6 /100 | #213 | Poor 18.8% |
| Immigrants | Sierra Leone | 10.8 /100 | #214 | Poor 18.7% |
| Eastern Europeans | 10.6 /100 | #215 | Poor 18.7% |
| Immigrants | Nigeria | 10.3 /100 | #216 | Poor 18.7% |
| Immigrants | Italy | 10.2 /100 | #217 | Poor 18.7% |
| Immigrants | Portugal | 8.9 /100 | #218 | Tragic 18.6% |
| Immigrants | Armenia | 8.6 /100 | #219 | Tragic 18.6% |
| Nigerians | 7.9 /100 | #220 | Tragic 18.6% |
| Immigrants | Poland | 7.5 /100 | #221 | Tragic 18.6% |
| Belizeans | 7.3 /100 | #222 | Tragic 18.6% |
| Immigrants | Czechoslovakia | 5.9 /100 | #223 | Tragic 18.5% |
| Immigrants | Argentina | 5.6 /100 | #224 | Tragic 18.5% |
| Immigrants | Lithuania | 5.6 /100 | #225 | Tragic 18.5% |
| Immigrants | Hungary | 5.5 /100 | #226 | Tragic 18.5% |