Trinidadian and Tobagonian vs Immigrants from Armenia 3 or more Vehicles in Household
COMPARE
Trinidadian and Tobagonian
Immigrants from Armenia
3 or more Vehicles in Household
3 or more Vehicles in Household Comparison
Trinidadians and Tobagonians
Immigrants from Armenia
13.6%
3 OR MORE VEHICLES IN HOUSEHOLD
0.0/ 100
METRIC RATING
332nd/ 347
METRIC RANK
18.6%
3 OR MORE VEHICLES IN HOUSEHOLD
8.6/ 100
METRIC RATING
219th/ 347
METRIC RANK
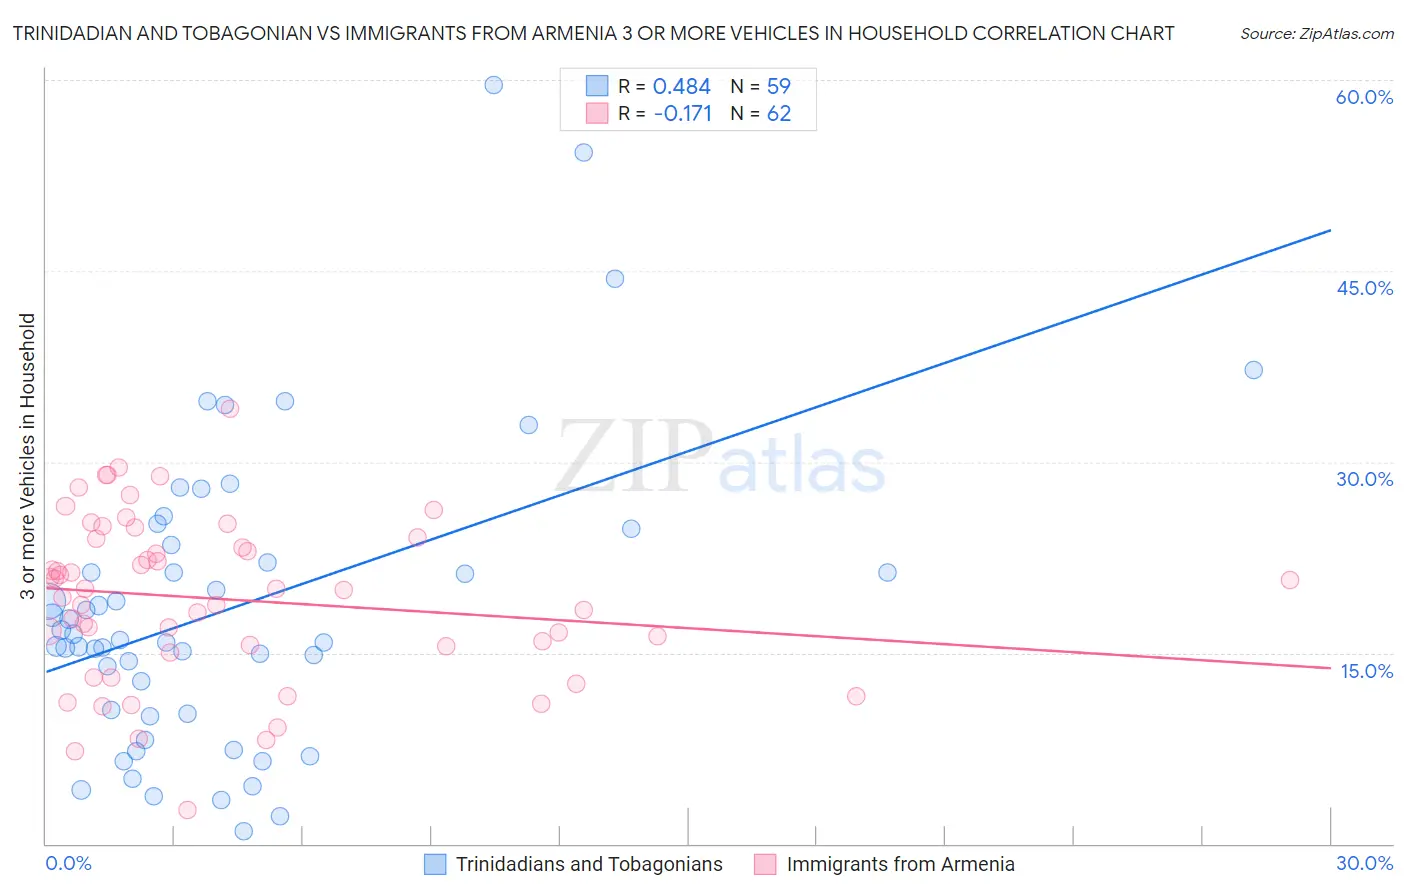
Trinidadian and Tobagonian vs Immigrants from Armenia 3 or more Vehicles in Household Correlation Chart
The statistical analysis conducted on geographies consisting of 219,661,129 people shows a moderate positive correlation between the proportion of Trinidadians and Tobagonians and percentage of households with 3 or more vehicles available in the United States with a correlation coefficient (R) of 0.484 and weighted average of 13.6%. Similarly, the statistical analysis conducted on geographies consisting of 97,705,679 people shows a poor negative correlation between the proportion of Immigrants from Armenia and percentage of households with 3 or more vehicles available in the United States with a correlation coefficient (R) of -0.171 and weighted average of 18.6%, a difference of 36.8%.
3 or more Vehicles in Household Correlation Summary
| Measurement | Trinidadian and Tobagonian | Immigrants from Armenia |
| Minimum | 1.0% | 2.7% |
| Maximum | 59.6% | 34.1% |
| Range | 58.6% | 31.5% |
| Mean | 18.6% | 19.2% |
| Median | 16.0% | 19.9% |
| Interquartile 25% (IQ1) | 10.2% | 15.5% |
| Interquartile 75% (IQ3) | 23.5% | 23.9% |
| Interquartile Range (IQR) | 13.3% | 8.5% |
| Standard Deviation (Sample) | 11.9% | 6.5% |
| Standard Deviation (Population) | 11.8% | 6.4% |
Similar Demographics by 3 or more Vehicles in Household
Demographics Similar to Trinidadians and Tobagonians by 3 or more Vehicles in Household
In terms of 3 or more vehicles in household, the demographic groups most similar to Trinidadians and Tobagonians are Immigrants from Cabo Verde (13.6%, a difference of 0.36%), Immigrants from Dominica (13.7%, a difference of 0.71%), West Indian (13.7%, a difference of 0.93%), Immigrants from Senegal (13.8%, a difference of 1.3%), and Immigrants from Ecuador (13.4%, a difference of 1.6%).
| Demographics | Rating | Rank | 3 or more Vehicles in Household |
| Senegalese | 0.0 /100 | #325 | Tragic 14.2% |
| Soviet Union | 0.0 /100 | #326 | Tragic 14.2% |
| Ecuadorians | 0.0 /100 | #327 | Tragic 14.1% |
| Immigrants | Albania | 0.0 /100 | #328 | Tragic 14.0% |
| Immigrants | Senegal | 0.0 /100 | #329 | Tragic 13.8% |
| West Indians | 0.0 /100 | #330 | Tragic 13.7% |
| Immigrants | Dominica | 0.0 /100 | #331 | Tragic 13.7% |
| Trinidadians and Tobagonians | 0.0 /100 | #332 | Tragic 13.6% |
| Immigrants | Cabo Verde | 0.0 /100 | #333 | Tragic 13.6% |
| Immigrants | Ecuador | 0.0 /100 | #334 | Tragic 13.4% |
| Immigrants | Trinidad and Tobago | 0.0 /100 | #335 | Tragic 13.3% |
| Barbadians | 0.0 /100 | #336 | Tragic 12.6% |
| Immigrants | Bangladesh | 0.0 /100 | #337 | Tragic 12.5% |
| Vietnamese | 0.0 /100 | #338 | Tragic 12.5% |
| Immigrants | Uzbekistan | 0.0 /100 | #339 | Tragic 12.0% |
Demographics Similar to Immigrants from Armenia by 3 or more Vehicles in Household
In terms of 3 or more vehicles in household, the demographic groups most similar to Immigrants from Armenia are Immigrants from Portugal (18.6%, a difference of 0.080%), Nigerian (18.6%, a difference of 0.20%), Immigrants from Poland (18.6%, a difference of 0.29%), Belizean (18.6%, a difference of 0.34%), and Immigrants from Italy (18.7%, a difference of 0.38%).
| Demographics | Rating | Rank | 3 or more Vehicles in Household |
| Panamanians | 11.6 /100 | #212 | Poor 18.8% |
| Immigrants | Cuba | 11.6 /100 | #213 | Poor 18.8% |
| Immigrants | Sierra Leone | 10.8 /100 | #214 | Poor 18.7% |
| Eastern Europeans | 10.6 /100 | #215 | Poor 18.7% |
| Immigrants | Nigeria | 10.3 /100 | #216 | Poor 18.7% |
| Immigrants | Italy | 10.2 /100 | #217 | Poor 18.7% |
| Immigrants | Portugal | 8.9 /100 | #218 | Tragic 18.6% |
| Immigrants | Armenia | 8.6 /100 | #219 | Tragic 18.6% |
| Nigerians | 7.9 /100 | #220 | Tragic 18.6% |
| Immigrants | Poland | 7.5 /100 | #221 | Tragic 18.6% |
| Belizeans | 7.3 /100 | #222 | Tragic 18.6% |
| Immigrants | Czechoslovakia | 5.9 /100 | #223 | Tragic 18.5% |
| Immigrants | Argentina | 5.6 /100 | #224 | Tragic 18.5% |
| Immigrants | Lithuania | 5.6 /100 | #225 | Tragic 18.5% |
| Immigrants | Hungary | 5.5 /100 | #226 | Tragic 18.5% |