Immigrants from Taiwan vs Immigrants from Honduras 3rd Grade
COMPARE
Immigrants from Taiwan
Immigrants from Honduras
3rd Grade
3rd Grade Comparison
Immigrants from Taiwan
Immigrants from Honduras
97.7%
3RD GRADE
34.2/ 100
METRIC RATING
188th/ 347
METRIC RANK
96.3%
3RD GRADE
0.0/ 100
METRIC RATING
329th/ 347
METRIC RANK
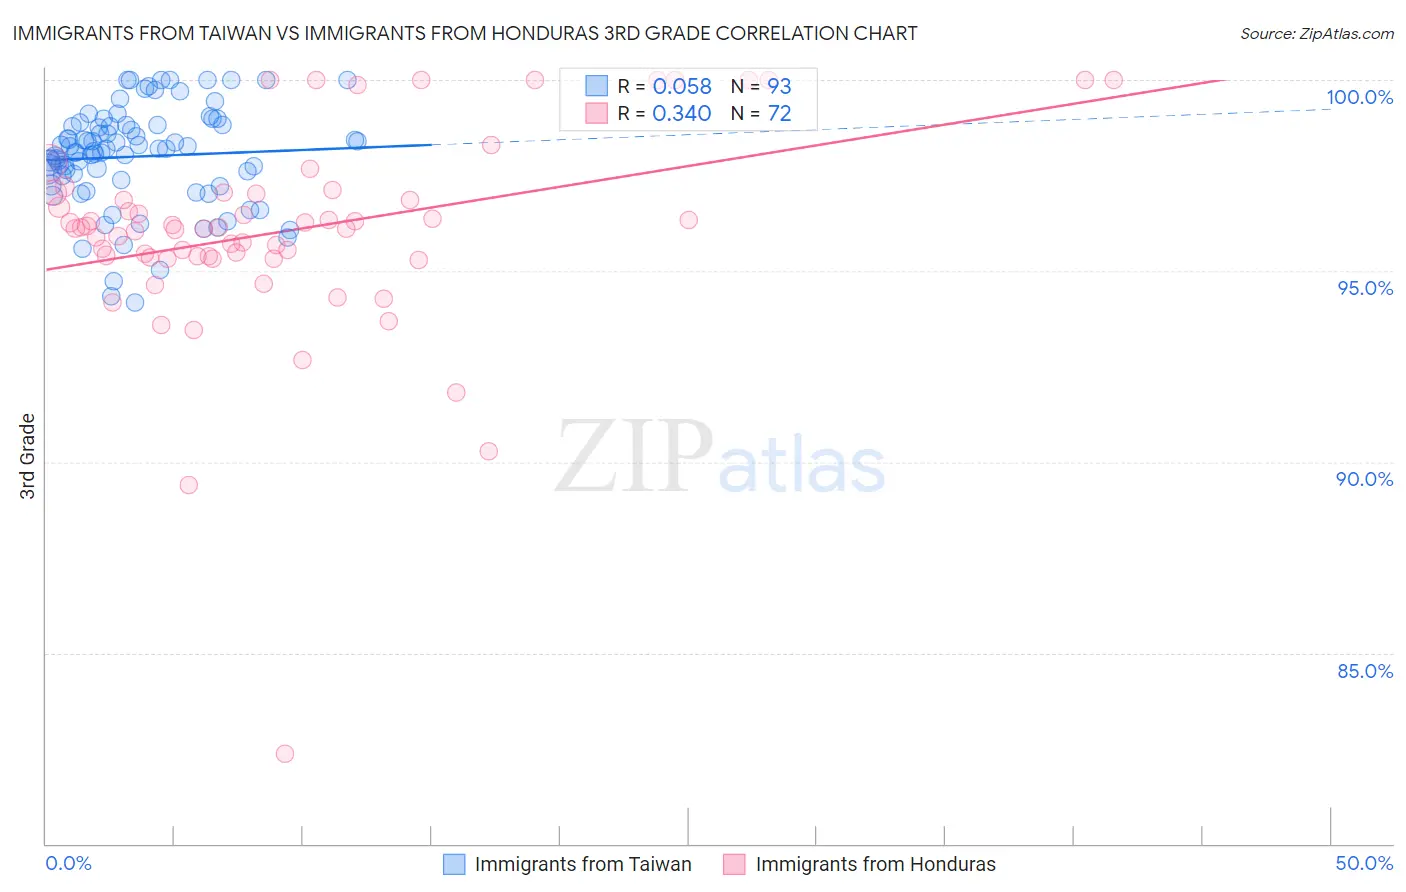
Immigrants from Taiwan vs Immigrants from Honduras 3rd Grade Correlation Chart
The statistical analysis conducted on geographies consisting of 298,069,082 people shows a slight positive correlation between the proportion of Immigrants from Taiwan and percentage of population with at least 3rd grade education in the United States with a correlation coefficient (R) of 0.058 and weighted average of 97.7%. Similarly, the statistical analysis conducted on geographies consisting of 322,637,445 people shows a mild positive correlation between the proportion of Immigrants from Honduras and percentage of population with at least 3rd grade education in the United States with a correlation coefficient (R) of 0.340 and weighted average of 96.3%, a difference of 1.4%.
3rd Grade Correlation Summary
| Measurement | Immigrants from Taiwan | Immigrants from Honduras |
| Minimum | 94.2% | 82.3% |
| Maximum | 100.0% | 100.0% |
| Range | 5.8% | 17.7% |
| Mean | 98.0% | 96.1% |
| Median | 98.2% | 96.1% |
| Interquartile 25% (IQ1) | 97.3% | 95.4% |
| Interquartile 75% (IQ3) | 98.8% | 97.0% |
| Interquartile Range (IQR) | 1.5% | 1.6% |
| Standard Deviation (Sample) | 1.3% | 2.7% |
| Standard Deviation (Population) | 1.3% | 2.7% |
Similar Demographics by 3rd Grade
Demographics Similar to Immigrants from Taiwan by 3rd Grade
In terms of 3rd grade, the demographic groups most similar to Immigrants from Taiwan are Native/Alaskan (97.7%, a difference of 0.0%), Pakistani (97.7%, a difference of 0.0%), Immigrants from Kazakhstan (97.7%, a difference of 0.010%), Immigrants from Argentina (97.7%, a difference of 0.010%), and Portuguese (97.7%, a difference of 0.010%).
| Demographics | Rating | Rank | 3rd Grade |
| Immigrants | Venezuela | 44.4 /100 | #181 | Average 97.7% |
| Argentineans | 42.9 /100 | #182 | Average 97.7% |
| Arabs | 40.0 /100 | #183 | Fair 97.7% |
| Immigrants | Kazakhstan | 37.4 /100 | #184 | Fair 97.7% |
| Immigrants | Argentina | 37.0 /100 | #185 | Fair 97.7% |
| Portuguese | 36.2 /100 | #186 | Fair 97.7% |
| Natives/Alaskans | 35.2 /100 | #187 | Fair 97.7% |
| Immigrants | Taiwan | 34.2 /100 | #188 | Fair 97.7% |
| Pakistanis | 34.2 /100 | #189 | Fair 97.7% |
| Panamanians | 31.5 /100 | #190 | Fair 97.7% |
| Blacks/African Americans | 29.6 /100 | #191 | Fair 97.7% |
| Mongolians | 29.1 /100 | #192 | Fair 97.7% |
| Immigrants | Kenya | 28.2 /100 | #193 | Fair 97.7% |
| Immigrants | Uganda | 27.4 /100 | #194 | Fair 97.7% |
| Immigrants | Egypt | 26.8 /100 | #195 | Fair 97.7% |
Demographics Similar to Immigrants from Honduras by 3rd Grade
In terms of 3rd grade, the demographic groups most similar to Immigrants from Honduras are Japanese (96.4%, a difference of 0.020%), Bangladeshi (96.3%, a difference of 0.020%), Immigrants from Vietnam (96.4%, a difference of 0.030%), Mexican American Indian (96.4%, a difference of 0.070%), and Dominican (96.4%, a difference of 0.080%).
| Demographics | Rating | Rank | 3rd Grade |
| Immigrants | Belize | 0.0 /100 | #322 | Tragic 96.5% |
| Hondurans | 0.0 /100 | #323 | Tragic 96.5% |
| Dominicans | 0.0 /100 | #324 | Tragic 96.4% |
| Mexican American Indians | 0.0 /100 | #325 | Tragic 96.4% |
| Immigrants | Vietnam | 0.0 /100 | #326 | Tragic 96.4% |
| Japanese | 0.0 /100 | #327 | Tragic 96.4% |
| Bangladeshis | 0.0 /100 | #328 | Tragic 96.3% |
| Immigrants | Honduras | 0.0 /100 | #329 | Tragic 96.3% |
| Immigrants | Armenia | 0.0 /100 | #330 | Tragic 96.3% |
| Immigrants | Latin America | 0.0 /100 | #331 | Tragic 96.2% |
| Mexicans | 0.0 /100 | #332 | Tragic 96.2% |
| Immigrants | Fiji | 0.0 /100 | #333 | Tragic 96.2% |
| Immigrants | Cambodia | 0.0 /100 | #334 | Tragic 96.2% |
| Immigrants | Dominican Republic | 0.0 /100 | #335 | Tragic 96.2% |
| Immigrants | Cabo Verde | 0.0 /100 | #336 | Tragic 96.2% |