Immigrants from Taiwan vs Immigrants from Honduras Unemployment Among Ages 55 to 59 years
COMPARE
Immigrants from Taiwan
Immigrants from Honduras
Unemployment Among Ages 55 to 59 years
Unemployment Among Ages 55 to 59 years Comparison
Immigrants from Taiwan
Immigrants from Honduras
4.6%
UNEMPLOYMENT AMONG AGES 55 TO 59 YEARS
98.7/ 100
METRIC RATING
72nd/ 347
METRIC RANK
5.1%
UNEMPLOYMENT AMONG AGES 55 TO 59 YEARS
0.5/ 100
METRIC RATING
247th/ 347
METRIC RANK
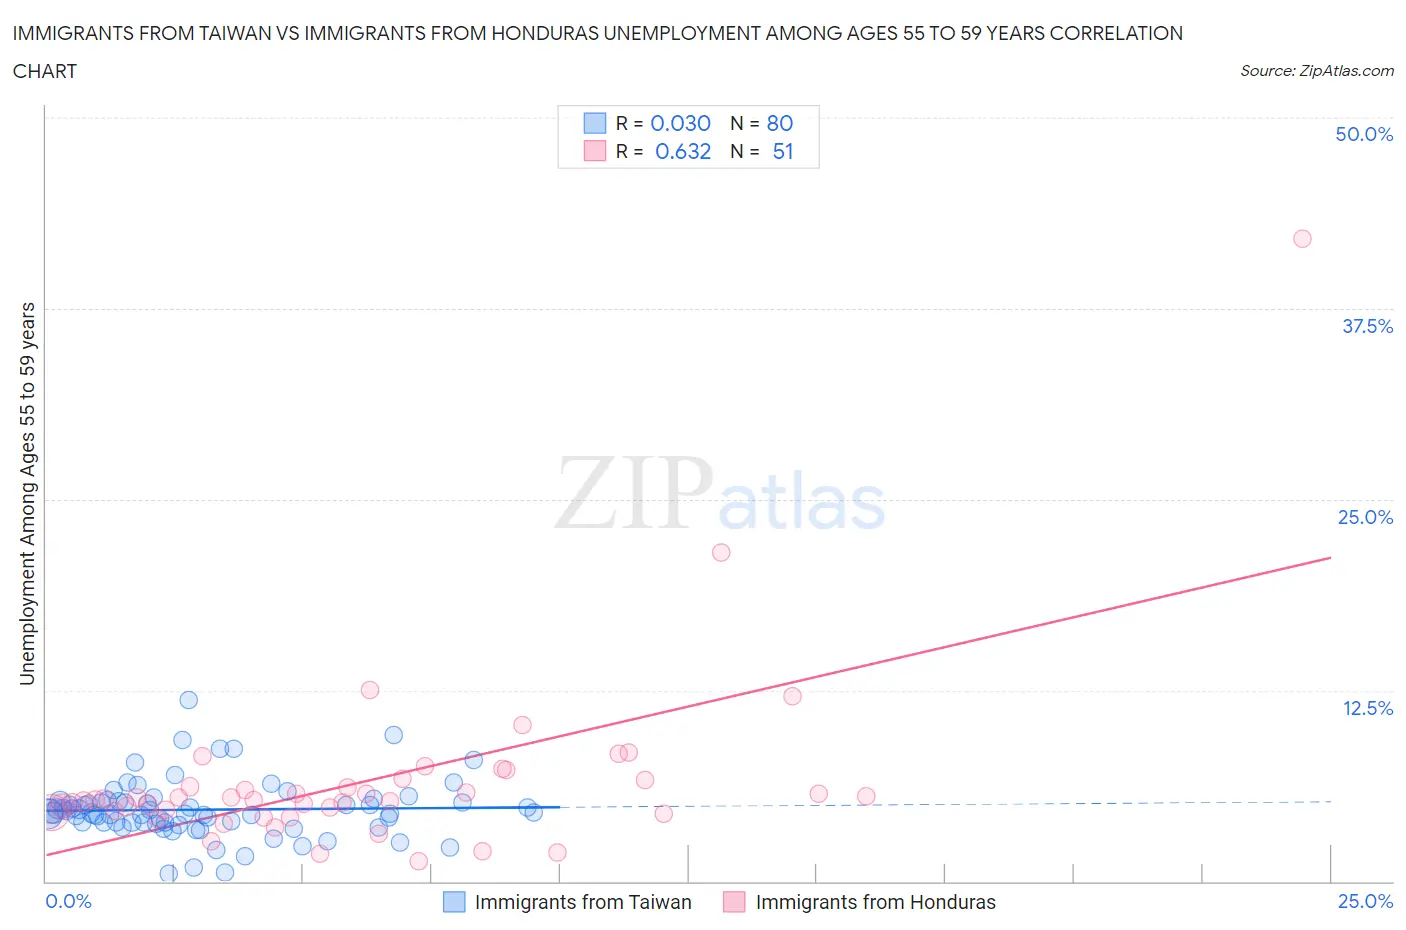
Immigrants from Taiwan vs Immigrants from Honduras Unemployment Among Ages 55 to 59 years Correlation Chart
The statistical analysis conducted on geographies consisting of 284,192,072 people shows no correlation between the proportion of Immigrants from Taiwan and unemployment rate among population between the ages 55 and 59 in the United States with a correlation coefficient (R) of 0.030 and weighted average of 4.6%. Similarly, the statistical analysis conducted on geographies consisting of 303,249,968 people shows a significant positive correlation between the proportion of Immigrants from Honduras and unemployment rate among population between the ages 55 and 59 in the United States with a correlation coefficient (R) of 0.632 and weighted average of 5.1%, a difference of 10.1%.
Unemployment Among Ages 55 to 59 years Correlation Summary
| Measurement | Immigrants from Taiwan | Immigrants from Honduras |
| Minimum | 0.50% | 1.3% |
| Maximum | 11.9% | 42.1% |
| Range | 11.4% | 40.8% |
| Mean | 4.7% | 6.6% |
| Median | 4.5% | 5.3% |
| Interquartile 25% (IQ1) | 3.8% | 4.5% |
| Interquartile 75% (IQ3) | 5.2% | 6.6% |
| Interquartile Range (IQR) | 1.4% | 2.1% |
| Standard Deviation (Sample) | 1.9% | 6.0% |
| Standard Deviation (Population) | 1.9% | 5.9% |
Similar Demographics by Unemployment Among Ages 55 to 59 years
Demographics Similar to Immigrants from Taiwan by Unemployment Among Ages 55 to 59 years
In terms of unemployment among ages 55 to 59 years, the demographic groups most similar to Immigrants from Taiwan are Immigrants from Jordan (4.6%, a difference of 0.040%), Filipino (4.6%, a difference of 0.070%), Bhutanese (4.6%, a difference of 0.080%), Croatian (4.6%, a difference of 0.15%), and Immigrants from Iraq (4.6%, a difference of 0.17%).
| Demographics | Rating | Rank | Unemployment Among Ages 55 to 59 years |
| Sudanese | 99.1 /100 | #65 | Exceptional 4.6% |
| Mongolians | 99.0 /100 | #66 | Exceptional 4.6% |
| Ugandans | 99.0 /100 | #67 | Exceptional 4.6% |
| Immigrants | Micronesia | 99.0 /100 | #68 | Exceptional 4.6% |
| Czechoslovakians | 99.0 /100 | #69 | Exceptional 4.6% |
| Filipinos | 98.8 /100 | #70 | Exceptional 4.6% |
| Immigrants | Jordan | 98.7 /100 | #71 | Exceptional 4.6% |
| Immigrants | Taiwan | 98.7 /100 | #72 | Exceptional 4.6% |
| Bhutanese | 98.6 /100 | #73 | Exceptional 4.6% |
| Croatians | 98.5 /100 | #74 | Exceptional 4.6% |
| Immigrants | Iraq | 98.5 /100 | #75 | Exceptional 4.6% |
| Immigrants | Bosnia and Herzegovina | 98.3 /100 | #76 | Exceptional 4.6% |
| Scotch-Irish | 98.3 /100 | #77 | Exceptional 4.6% |
| Finns | 98.2 /100 | #78 | Exceptional 4.6% |
| Sri Lankans | 98.1 /100 | #79 | Exceptional 4.6% |
Demographics Similar to Immigrants from Honduras by Unemployment Among Ages 55 to 59 years
In terms of unemployment among ages 55 to 59 years, the demographic groups most similar to Immigrants from Honduras are Immigrants from Greece (5.1%, a difference of 0.010%), Soviet Union (5.1%, a difference of 0.030%), Native Hawaiian (5.1%, a difference of 0.17%), Comanche (5.1%, a difference of 0.20%), and Immigrants from Fiji (5.1%, a difference of 0.24%).
| Demographics | Rating | Rank | Unemployment Among Ages 55 to 59 years |
| Immigrants | Costa Rica | 1.1 /100 | #240 | Tragic 5.0% |
| Brazilians | 1.0 /100 | #241 | Tragic 5.0% |
| Liberians | 0.9 /100 | #242 | Tragic 5.1% |
| Hondurans | 0.7 /100 | #243 | Tragic 5.1% |
| Immigrants | Fiji | 0.7 /100 | #244 | Tragic 5.1% |
| Soviet Union | 0.6 /100 | #245 | Tragic 5.1% |
| Immigrants | Greece | 0.6 /100 | #246 | Tragic 5.1% |
| Immigrants | Honduras | 0.5 /100 | #247 | Tragic 5.1% |
| Native Hawaiians | 0.5 /100 | #248 | Tragic 5.1% |
| Comanche | 0.4 /100 | #249 | Tragic 5.1% |
| Cheyenne | 0.4 /100 | #250 | Tragic 5.1% |
| Portuguese | 0.3 /100 | #251 | Tragic 5.1% |
| U.S. Virgin Islanders | 0.3 /100 | #252 | Tragic 5.1% |
| Paraguayans | 0.3 /100 | #253 | Tragic 5.1% |
| Seminole | 0.3 /100 | #254 | Tragic 5.1% |