Chilean vs Immigrants from Poland 2 or more Vehicles in Household
COMPARE
Chilean
Immigrants from Poland
2 or more Vehicles in Household
2 or more Vehicles in Household Comparison
Chileans
Immigrants from Poland
56.1%
2 OR MORE VEHICLES IN HOUSEHOLD
80.2/ 100
METRIC RATING
149th/ 347
METRIC RANK
54.6%
2 OR MORE VEHICLES IN HOUSEHOLD
19.3/ 100
METRIC RATING
196th/ 347
METRIC RANK
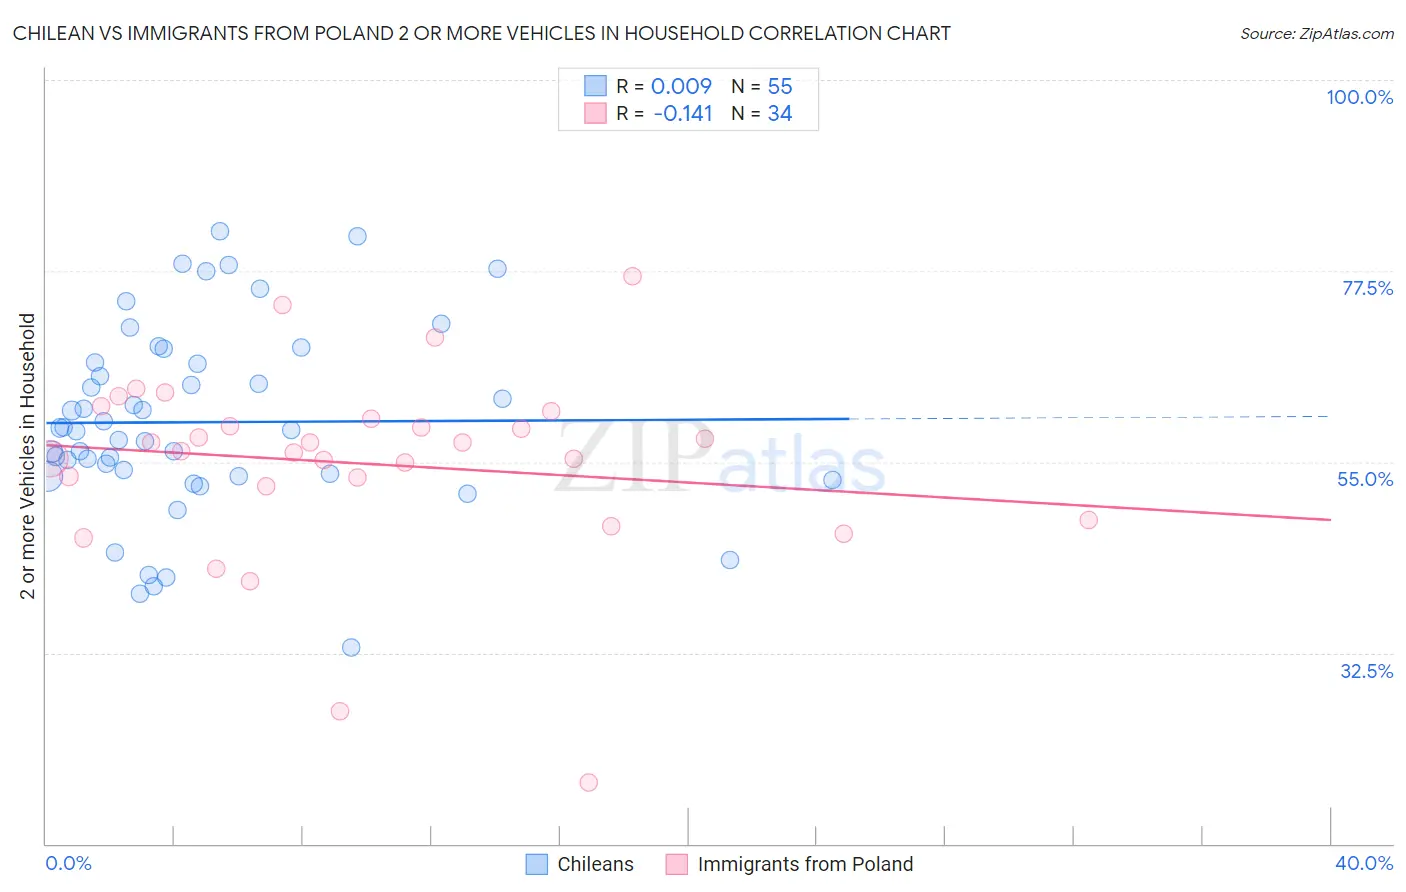
Chilean vs Immigrants from Poland 2 or more Vehicles in Household Correlation Chart
The statistical analysis conducted on geographies consisting of 256,591,468 people shows no correlation between the proportion of Chileans and percentage of households with 2 or more vehicles available in the United States with a correlation coefficient (R) of 0.009 and weighted average of 56.1%. Similarly, the statistical analysis conducted on geographies consisting of 304,779,004 people shows a poor negative correlation between the proportion of Immigrants from Poland and percentage of households with 2 or more vehicles available in the United States with a correlation coefficient (R) of -0.141 and weighted average of 54.6%, a difference of 2.9%.
2 or more Vehicles in Household Correlation Summary
| Measurement | Chilean | Immigrants from Poland |
| Minimum | 33.1% | 17.2% |
| Maximum | 82.2% | 76.9% |
| Range | 49.1% | 59.6% |
| Mean | 59.7% | 54.8% |
| Median | 58.8% | 56.7% |
| Interquartile 25% (IQ1) | 53.3% | 52.2% |
| Interquartile 75% (IQ3) | 66.7% | 60.1% |
| Interquartile Range (IQR) | 13.4% | 8.0% |
| Standard Deviation (Sample) | 11.2% | 11.5% |
| Standard Deviation (Population) | 11.1% | 11.3% |
Similar Demographics by 2 or more Vehicles in Household
Demographics Similar to Chileans by 2 or more Vehicles in Household
In terms of 2 or more vehicles in household, the demographic groups most similar to Chileans are Immigrants from Moldova (56.1%, a difference of 0.0%), Serbian (56.1%, a difference of 0.010%), Nicaraguan (56.1%, a difference of 0.020%), Venezuelan (56.1%, a difference of 0.030%), and Syrian (56.2%, a difference of 0.060%).
| Demographics | Rating | Rank | 2 or more Vehicles in Household |
| South Africans | 83.1 /100 | #142 | Excellent 56.2% |
| Seminole | 81.7 /100 | #143 | Excellent 56.2% |
| Immigrants | Syria | 81.4 /100 | #144 | Excellent 56.2% |
| Syrians | 81.2 /100 | #145 | Excellent 56.2% |
| Venezuelans | 80.7 /100 | #146 | Excellent 56.1% |
| Serbians | 80.3 /100 | #147 | Excellent 56.1% |
| Immigrants | Moldova | 80.2 /100 | #148 | Excellent 56.1% |
| Chileans | 80.2 /100 | #149 | Excellent 56.1% |
| Nicaraguans | 79.9 /100 | #150 | Good 56.1% |
| Immigrants | Northern Europe | 78.7 /100 | #151 | Good 56.1% |
| Immigrants | Pakistan | 78.1 /100 | #152 | Good 56.1% |
| Lumbee | 71.9 /100 | #153 | Good 55.9% |
| Ukrainians | 70.8 /100 | #154 | Good 55.8% |
| Immigrants | Venezuela | 70.7 /100 | #155 | Good 55.8% |
| Immigrants | Lithuania | 70.4 /100 | #156 | Good 55.8% |
Demographics Similar to Immigrants from Poland by 2 or more Vehicles in Household
In terms of 2 or more vehicles in household, the demographic groups most similar to Immigrants from Poland are Argentinean (54.5%, a difference of 0.12%), Iroquois (54.7%, a difference of 0.20%), Carpatho Rusyn (54.4%, a difference of 0.21%), Central American (54.7%, a difference of 0.22%), and Immigrants from Norway (54.4%, a difference of 0.24%).
| Demographics | Rating | Rank | 2 or more Vehicles in Household |
| Eastern Europeans | 27.5 /100 | #189 | Fair 54.8% |
| Russians | 26.3 /100 | #190 | Fair 54.8% |
| Immigrants | Immigrants | 25.0 /100 | #191 | Fair 54.7% |
| Immigrants | Romania | 23.8 /100 | #192 | Fair 54.7% |
| Immigrants | Japan | 23.4 /100 | #193 | Fair 54.7% |
| Central Americans | 23.0 /100 | #194 | Fair 54.7% |
| Iroquois | 22.6 /100 | #195 | Fair 54.7% |
| Immigrants | Poland | 19.3 /100 | #196 | Poor 54.6% |
| Argentineans | 17.5 /100 | #197 | Poor 54.5% |
| Carpatho Rusyns | 16.2 /100 | #198 | Poor 54.4% |
| Immigrants | Norway | 15.9 /100 | #199 | Poor 54.4% |
| Houma | 15.8 /100 | #200 | Poor 54.4% |
| Immigrants | Italy | 15.5 /100 | #201 | Poor 54.4% |
| Immigrants | North Macedonia | 14.9 /100 | #202 | Poor 54.4% |
| Immigrants | Peru | 14.3 /100 | #203 | Poor 54.4% |