Immigrants from Switzerland vs Immigrants from Russia Single Mother Households
COMPARE
Immigrants from Switzerland
Immigrants from Russia
Single Mother Households
Single Mother Households Comparison
Immigrants from Switzerland
Immigrants from Russia
5.3%
SINGLE MOTHER HOUSEHOLDS
99.7/ 100
METRIC RATING
33rd/ 347
METRIC RANK
5.5%
SINGLE MOTHER HOUSEHOLDS
99.1/ 100
METRIC RATING
53rd/ 347
METRIC RANK
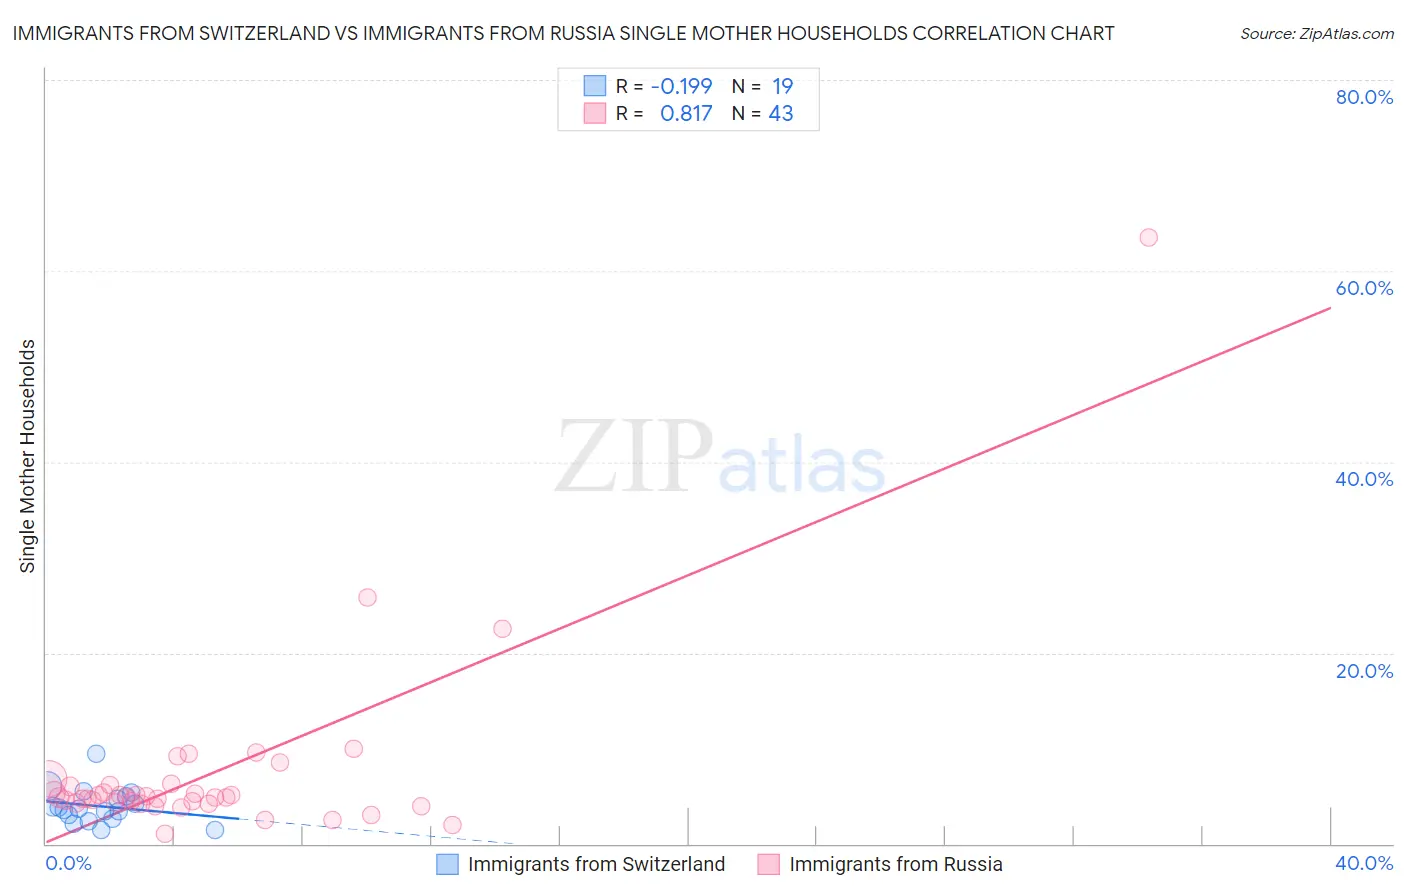
Immigrants from Switzerland vs Immigrants from Russia Single Mother Households Correlation Chart
The statistical analysis conducted on geographies consisting of 147,838,806 people shows a poor negative correlation between the proportion of Immigrants from Switzerland and percentage of single mother households in the United States with a correlation coefficient (R) of -0.199 and weighted average of 5.3%. Similarly, the statistical analysis conducted on geographies consisting of 346,998,386 people shows a very strong positive correlation between the proportion of Immigrants from Russia and percentage of single mother households in the United States with a correlation coefficient (R) of 0.817 and weighted average of 5.5%, a difference of 3.6%.
Single Mother Households Correlation Summary
| Measurement | Immigrants from Switzerland | Immigrants from Russia |
| Minimum | 1.5% | 1.1% |
| Maximum | 9.5% | 63.5% |
| Range | 8.0% | 62.4% |
| Mean | 3.9% | 7.3% |
| Median | 3.7% | 4.9% |
| Interquartile 25% (IQ1) | 2.6% | 4.3% |
| Interquartile 75% (IQ3) | 5.0% | 6.2% |
| Interquartile Range (IQR) | 2.3% | 1.9% |
| Standard Deviation (Sample) | 1.9% | 9.9% |
| Standard Deviation (Population) | 1.8% | 9.7% |
Demographics Similar to Immigrants from Switzerland and Immigrants from Russia by Single Mother Households
In terms of single mother households, the demographic groups most similar to Immigrants from Switzerland are Bulgarian (5.3%, a difference of 0.020%), Immigrants from Northern Europe (5.3%, a difference of 0.060%), Immigrants from Czechoslovakia (5.3%, a difference of 0.26%), Immigrants from Belgium (5.3%, a difference of 0.41%), and Immigrants from Serbia (5.4%, a difference of 0.84%). Similarly, the demographic groups most similar to Immigrants from Russia are Swedish (5.5%, a difference of 0.10%), Immigrants from Belarus (5.5%, a difference of 0.17%), Immigrants from Scotland (5.5%, a difference of 0.18%), Immigrants from Latvia (5.5%, a difference of 0.37%), and Turkish (5.5%, a difference of 0.40%).
| Demographics | Rating | Rank | Single Mother Households |
| Immigrants | Switzerland | 99.7 /100 | #33 | Exceptional 5.3% |
| Bulgarians | 99.7 /100 | #34 | Exceptional 5.3% |
| Immigrants | Northern Europe | 99.7 /100 | #35 | Exceptional 5.3% |
| Immigrants | Czechoslovakia | 99.7 /100 | #36 | Exceptional 5.3% |
| Immigrants | Belgium | 99.7 /100 | #37 | Exceptional 5.3% |
| Immigrants | Serbia | 99.6 /100 | #38 | Exceptional 5.4% |
| Immigrants | Sweden | 99.6 /100 | #39 | Exceptional 5.4% |
| Estonians | 99.6 /100 | #40 | Exceptional 5.4% |
| Immigrants | Greece | 99.5 /100 | #41 | Exceptional 5.4% |
| Macedonians | 99.5 /100 | #42 | Exceptional 5.4% |
| Immigrants | South Central Asia | 99.5 /100 | #43 | Exceptional 5.4% |
| Lithuanians | 99.4 /100 | #44 | Exceptional 5.4% |
| Immigrants | Croatia | 99.4 /100 | #45 | Exceptional 5.4% |
| Croatians | 99.3 /100 | #46 | Exceptional 5.5% |
| Norwegians | 99.3 /100 | #47 | Exceptional 5.5% |
| Turks | 99.2 /100 | #48 | Exceptional 5.5% |
| Immigrants | Latvia | 99.2 /100 | #49 | Exceptional 5.5% |
| Immigrants | Scotland | 99.2 /100 | #50 | Exceptional 5.5% |
| Immigrants | Belarus | 99.2 /100 | #51 | Exceptional 5.5% |
| Swedes | 99.1 /100 | #52 | Exceptional 5.5% |
| Immigrants | Russia | 99.1 /100 | #53 | Exceptional 5.5% |