Swedish vs Immigrants from Greece 3 or more Vehicles in Household
COMPARE
Swedish
Immigrants from Greece
3 or more Vehicles in Household
3 or more Vehicles in Household Comparison
Swedes
Immigrants from Greece
23.0%
3 OR MORE VEHICLES IN HOUSEHOLD
100.0/ 100
METRIC RATING
37th/ 347
METRIC RANK
16.5%
3 OR MORE VEHICLES IN HOUSEHOLD
0.0/ 100
METRIC RATING
302nd/ 347
METRIC RANK
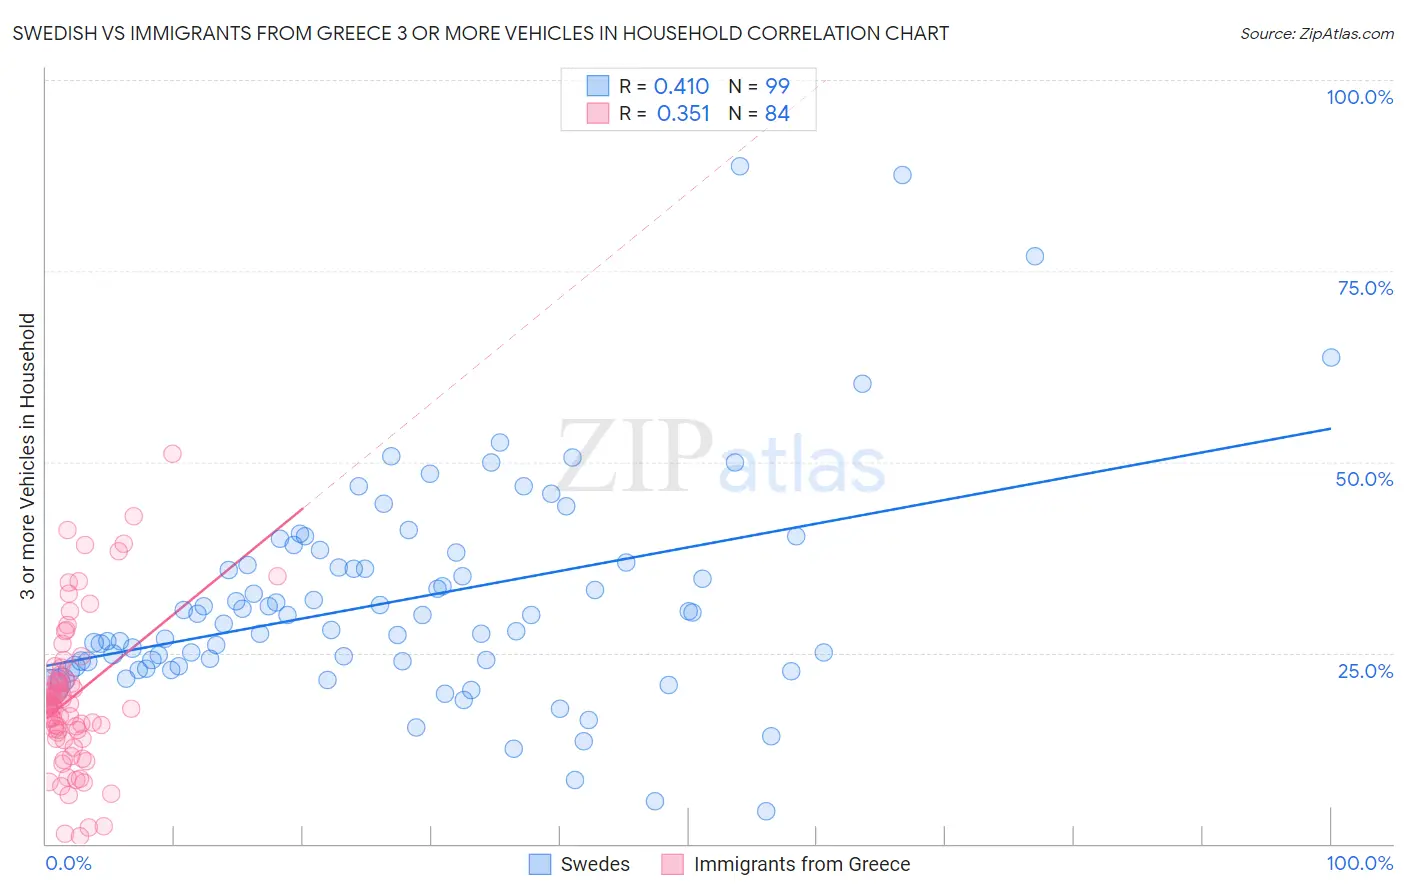
Swedish vs Immigrants from Greece 3 or more Vehicles in Household Correlation Chart
The statistical analysis conducted on geographies consisting of 538,531,467 people shows a moderate positive correlation between the proportion of Swedes and percentage of households with 3 or more vehicles available in the United States with a correlation coefficient (R) of 0.410 and weighted average of 23.0%. Similarly, the statistical analysis conducted on geographies consisting of 216,821,688 people shows a mild positive correlation between the proportion of Immigrants from Greece and percentage of households with 3 or more vehicles available in the United States with a correlation coefficient (R) of 0.351 and weighted average of 16.5%, a difference of 39.4%.
3 or more Vehicles in Household Correlation Summary
| Measurement | Swedish | Immigrants from Greece |
| Minimum | 4.2% | 1.0% |
| Maximum | 88.7% | 51.1% |
| Range | 84.5% | 50.1% |
| Mean | 31.8% | 19.2% |
| Median | 29.9% | 18.2% |
| Interquartile 25% (IQ1) | 23.3% | 14.2% |
| Interquartile 75% (IQ3) | 36.8% | 21.8% |
| Interquartile Range (IQR) | 13.5% | 7.6% |
| Standard Deviation (Sample) | 14.4% | 9.7% |
| Standard Deviation (Population) | 14.3% | 9.6% |
Similar Demographics by 3 or more Vehicles in Household
Demographics Similar to Swedes by 3 or more Vehicles in Household
In terms of 3 or more vehicles in household, the demographic groups most similar to Swedes are Cherokee (23.0%, a difference of 0.030%), Choctaw (23.0%, a difference of 0.070%), Swiss (23.0%, a difference of 0.080%), Spanish American (23.0%, a difference of 0.14%), and Pueblo (23.0%, a difference of 0.20%).
| Demographics | Rating | Rank | 3 or more Vehicles in Household |
| Immigrants | South Eastern Asia | 100.0 /100 | #30 | Exceptional 23.1% |
| English | 100.0 /100 | #31 | Exceptional 23.1% |
| Pueblo | 100.0 /100 | #32 | Exceptional 23.0% |
| Spanish Americans | 100.0 /100 | #33 | Exceptional 23.0% |
| Swiss | 100.0 /100 | #34 | Exceptional 23.0% |
| Choctaw | 100.0 /100 | #35 | Exceptional 23.0% |
| Cherokee | 100.0 /100 | #36 | Exceptional 23.0% |
| Swedes | 100.0 /100 | #37 | Exceptional 23.0% |
| Dutch | 100.0 /100 | #38 | Exceptional 22.9% |
| Yaqui | 100.0 /100 | #39 | Exceptional 22.9% |
| Europeans | 100.0 /100 | #40 | Exceptional 22.9% |
| Germans | 100.0 /100 | #41 | Exceptional 22.7% |
| Natives/Alaskans | 100.0 /100 | #42 | Exceptional 22.7% |
| Osage | 100.0 /100 | #43 | Exceptional 22.7% |
| Cheyenne | 100.0 /100 | #44 | Exceptional 22.7% |
Demographics Similar to Immigrants from Greece by 3 or more Vehicles in Household
In terms of 3 or more vehicles in household, the demographic groups most similar to Immigrants from Greece are Immigrants from Serbia (16.4%, a difference of 0.31%), Paraguayan (16.6%, a difference of 0.43%), Ghanaian (16.4%, a difference of 0.78%), Cypriot (16.6%, a difference of 0.83%), and Immigrants from Morocco (16.3%, a difference of 1.0%).
| Demographics | Rating | Rank | 3 or more Vehicles in Household |
| Immigrants | Russia | 0.1 /100 | #295 | Tragic 16.9% |
| Inupiat | 0.1 /100 | #296 | Tragic 16.9% |
| Israelis | 0.1 /100 | #297 | Tragic 16.8% |
| Immigrants | Zaire | 0.1 /100 | #298 | Tragic 16.7% |
| Immigrants | South America | 0.1 /100 | #299 | Tragic 16.7% |
| Cypriots | 0.0 /100 | #300 | Tragic 16.6% |
| Paraguayans | 0.0 /100 | #301 | Tragic 16.6% |
| Immigrants | Greece | 0.0 /100 | #302 | Tragic 16.5% |
| Immigrants | Serbia | 0.0 /100 | #303 | Tragic 16.4% |
| Ghanaians | 0.0 /100 | #304 | Tragic 16.4% |
| Immigrants | Morocco | 0.0 /100 | #305 | Tragic 16.3% |
| Somalis | 0.0 /100 | #306 | Tragic 16.2% |
| Immigrants | Ghana | 0.0 /100 | #307 | Tragic 16.2% |
| Houma | 0.0 /100 | #308 | Tragic 16.1% |
| Immigrants | Somalia | 0.0 /100 | #309 | Tragic 15.9% |