Immigrants from Sudan vs Polish 8th Grade

COMPARE

Immigrants from Sudan
Race
Ancestry
AfghanAfricanAlaska NativeAlaskan AthabascanAlbanianAleutAlsatianAmericanApacheArabArapahoArgentineanArmenianAssyrian/Chaldean/SyriacAustralianAustrianBahamianBangladeshiBarbadianBasqueBelgianBelizeanBermudanBhutaneseBlackfeetBolivianBrazilianBritishBritish West IndianBulgarianBurmeseCajunCambodianCanadianCape VerdeanCarpatho RusynCelticCentral AmericanCentral American IndianCherokeeCheyenneChickasawChileanChineseChippewaChoctawColombianColvilleComancheCosta RicanCreeCreekCroatianCrowCubanCypriotCzechCzechoslovakianDanishDelawareDominicanDutchDutch West IndianEastern EuropeanEcuadorianEgyptianEnglishEstonianEthiopianEuropeanFijianFilipinoFinnishFrenchFrench American IndianFrench CanadianGermanGerman RussianGhanaianGreekGuamanian/ChamorroGuatemalanGuyaneseHaitianHmongHonduranHopiHoumaHungarianIcelanderIndian (Asian)IndonesianInupiatIranianIraqiIrishIroquoisIsraeliItalianJamaicanJapaneseJordanianKenyanKiowaKoreanLaotianLatvianLebaneseLiberianLithuanianLumbeeLuxembourgerMacedonianMalaysianMalteseMarshalleseMenomineeMexicanMexican American IndianMongolianMoroccanNative HawaiianNavajoNepaleseNew ZealanderNicaraguanNigerianNorthern EuropeanNorwegianOkinawanOsageOttawaPaiutePakistaniPalestinianPanamanianParaguayanPennsylvania GermanPeruvianPimaPortuguesePotawatomiPuebloPuerto RicanPuget Sound SalishRomanianRussianSalvadoranSamoanScandinavianScotch-IrishScottishSeminoleSenegaleseSerbianShoshoneSierra LeoneanSiouxSlavicSlovakSloveneSomaliSouth AfricanSouth AmericanSouth American IndianSoviet UnionSpaniardSpanishSpanish AmericanSpanish American IndianSri LankanSubsaharan AfricanSudaneseSwedishSwissSyrianTaiwaneseThaiTlingit-HaidaTohono O'OdhamTonganTrinidadian and TobagonianTsimshianTurkishU.S. Virgin IslanderUgandanUkrainianUruguayanUteVenezuelanVietnameseWelshWest IndianYakamaYaquiYugoslavianYumanYup'ikZimbabwean
Immigration
NonimmigrantsImmigrantsAfghanistanAfricaAlbaniaArgentinaArmeniaAsiaAustraliaAustriaBahamasBangladeshBarbadosBelarusBelgiumBelizeBoliviaBosnia and HerzegovinaBrazilBulgariaBurma/MyanmarCabo VerdeCambodiaCameroonCanadaCaribbeanCentral AmericaChileChinaColombiaCongoCosta RicaCroatiaCubaCzechoslovakiaDenmarkDominicaDominican RepublicEastern AfricaEastern AsiaEastern EuropeEcuadorEgyptEl SalvadorEnglandEritreaEthiopiaEuropeFijiFranceGermanyGhanaGreeceGrenadaGuatemalaGuyanaHaitiHondurasHong KongHungaryIndiaIndonesiaIranIraqIrelandIsraelItalyJamaicaJapanJordanKazakhstanKenyaKoreaKuwaitLaosLatin AmericaLatviaLebanonLiberiaLithuaniaMalaysiaMexicoMicronesiaMiddle AfricaMoldovaMoroccoNepalNetherlandsNicaraguaNigeriaNorth AmericaNorth MacedoniaNorthern AfricaNorthern EuropeNorwayOceaniaPakistanPanamaPeruPhilippinesPolandPortugalRomaniaRussiaSaudi ArabiaScotlandSenegalSerbiaSierra LeoneSingaporeSomaliaSouth AfricaSouth AmericaSouth Central AsiaSouth Eastern AsiaSouthern EuropeSpainSri LankaSt. Vincent and the GrenadinesSudanSwedenSwitzerlandSyriaTaiwanThailandTrinidad and TobagoTurkeyUgandaUkraineUruguayUzbekistanVenezuelaVietnamWest IndiesWestern AfricaWestern AsiaWestern EuropeYemenZaireZimbabweAzores
Polish
Race
Ancestry
AfghanAfricanAlaska NativeAlaskan AthabascanAlbanianAleutAlsatianAmericanApacheArabArapahoArgentineanArmenianAssyrian/Chaldean/SyriacAustralianAustrianBahamianBangladeshiBarbadianBasqueBelgianBelizeanBermudanBhutaneseBlackfeetBolivianBrazilianBritishBritish West IndianBulgarianBurmeseCajunCambodianCanadianCape VerdeanCarpatho RusynCelticCentral AmericanCentral American IndianCherokeeCheyenneChickasawChileanChineseChippewaChoctawColombianColvilleComancheCosta RicanCreeCreekCroatianCrowCubanCypriotCzechCzechoslovakianDanishDelawareDominicanDutchDutch West IndianEastern EuropeanEcuadorianEgyptianEnglishEstonianEthiopianEuropeanFijianFilipinoFinnishFrenchFrench American IndianFrench CanadianGermanGerman RussianGhanaianGreekGuamanian/ChamorroGuatemalanGuyaneseHaitianHmongHonduranHopiHoumaHungarianIcelanderIndian (Asian)IndonesianInupiatIranianIraqiIrishIroquoisIsraeliItalianJamaicanJapaneseJordanianKenyanKiowaKoreanLaotianLatvianLebaneseLiberianLithuanianLumbeeLuxembourgerMacedonianMalaysianMalteseMarshalleseMenomineeMexicanMexican American IndianMongolianMoroccanNative HawaiianNavajoNepaleseNew ZealanderNicaraguanNigerianNorthern EuropeanNorwegianOkinawanOsageOttawaPaiutePakistaniPalestinianPanamanianParaguayanPennsylvania GermanPeruvianPimaPolishPortuguesePotawatomiPuebloPuerto RicanPuget Sound SalishRomanianRussianSalvadoranSamoanScandinavianScotch-IrishScottishSeminoleSenegaleseSerbianShoshoneSierra LeoneanSiouxSlavicSlovakSloveneSomaliSouth AfricanSouth AmericanSouth American IndianSoviet UnionSpaniardSpanishSpanish AmericanSpanish American IndianSri LankanSubsaharan AfricanSudaneseSwedishSwissSyrianTaiwaneseThaiTlingit-HaidaTohono O'OdhamTonganTrinidadian and TobagonianTsimshianTurkishU.S. Virgin IslanderUgandanUkrainianUruguayanUteVenezuelanVietnameseWelshWest IndianYakamaYaquiYugoslavianYumanYup'ikZimbabwean
Immigration
NonimmigrantsImmigrantsAfghanistanAfricaAlbaniaArgentinaArmeniaAsiaAustraliaAustriaBahamasBangladeshBarbadosBelarusBelgiumBelizeBoliviaBosnia and HerzegovinaBrazilBulgariaBurma/MyanmarCabo VerdeCambodiaCameroonCanadaCaribbeanCentral AmericaChileChinaColombiaCongoCosta RicaCroatiaCubaCzechoslovakiaDenmarkDominicaDominican RepublicEastern AfricaEastern AsiaEastern EuropeEcuadorEgyptEl SalvadorEnglandEritreaEthiopiaEuropeFijiFranceGermanyGhanaGreeceGrenadaGuatemalaGuyanaHaitiHondurasHong KongHungaryIndiaIndonesiaIranIraqIrelandIsraelItalyJamaicaJapanJordanKazakhstanKenyaKoreaKuwaitLaosLatin AmericaLatviaLebanonLiberiaLithuaniaMalaysiaMexicoMicronesiaMiddle AfricaMoldovaMoroccoNepalNetherlandsNicaraguaNigeriaNorth AmericaNorth MacedoniaNorthern AfricaNorthern EuropeNorwayOceaniaPakistanPanamaPeruPhilippinesPolandPortugalRomaniaRussiaSaudi ArabiaScotlandSenegalSerbiaSierra LeoneSingaporeSomaliaSouth AfricaSouth AmericaSouth Central AsiaSouth Eastern AsiaSouthern EuropeSpainSri LankaSt. Vincent and the GrenadinesSwedenSwitzerlandSyriaTaiwanThailandTrinidad and TobagoTurkeyUgandaUkraineUruguayUzbekistanVenezuelaVietnamWest IndiesWestern AfricaWestern AsiaWestern EuropeYemenZaireZimbabweAzores
8th Grade
Income
Poverty
Unemployment
Labor Participation
Family Structure
Vehicle Availability
Education Level
Disability

8th Grade Comparison

Immigrants from Sudan

Poles

Poor
Exceptional
95.5%
8TH GRADE
15.1/ 100
METRIC RATING
207th/ 347
METRIC RANK
97.4%
8TH GRADE
100.0/ 100
METRIC RATING
11th/ 347
METRIC RANK

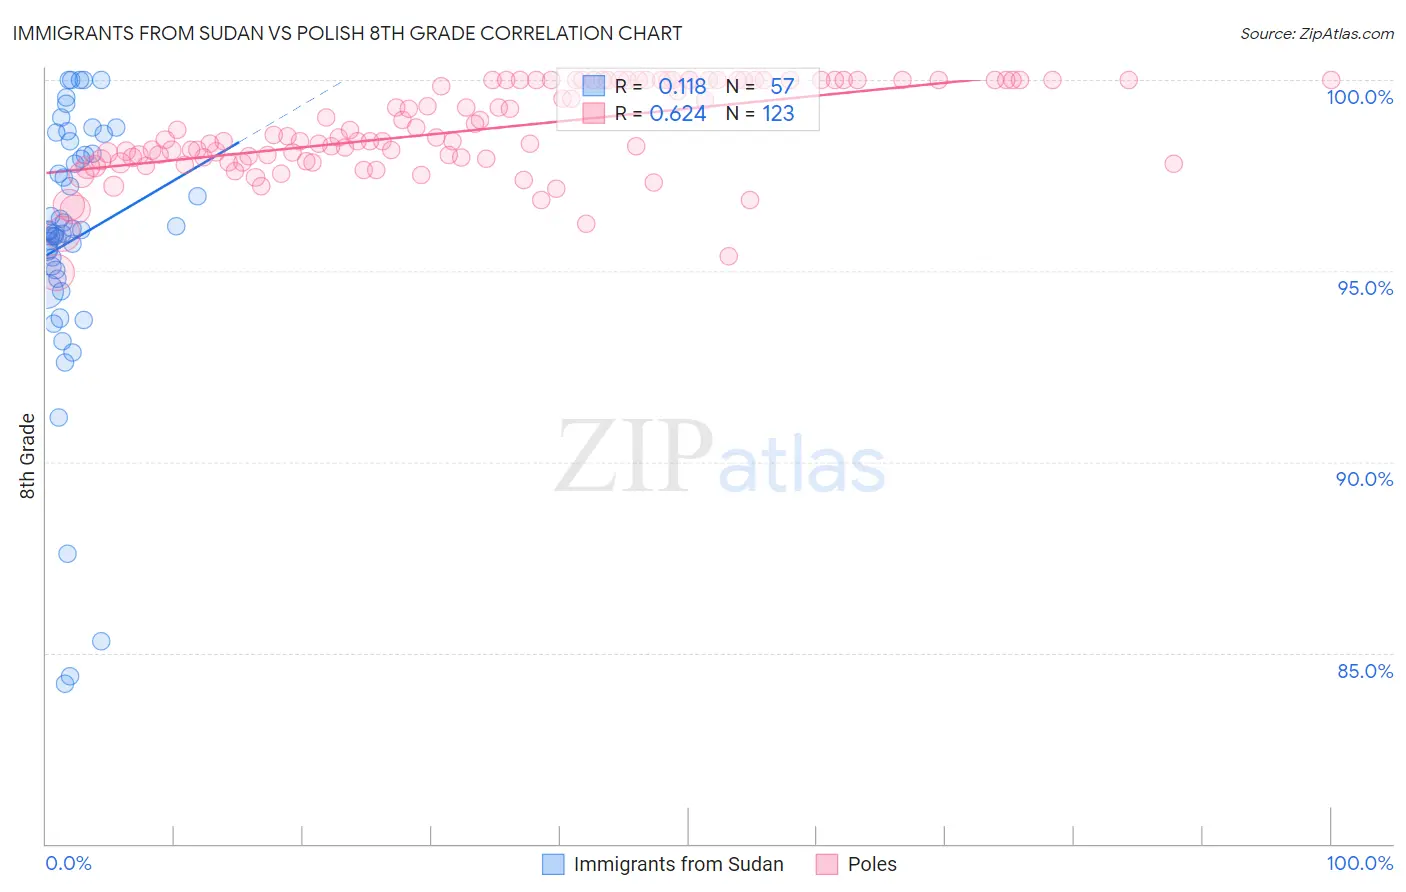
Immigrants from Sudan vs Polish 8th Grade Correlation Chart

The statistical analysis conducted on geographies consisting of 118,959,807 people shows a poor positive correlation between the proportion of Immigrants from Sudan and percentage of population with at least 8th grade education in the United States with a correlation coefficient (R) of 0.118 and weighted average of 95.5%. Similarly, the statistical analysis conducted on geographies consisting of 475,812,379 people shows a significant positive correlation between the proportion of Poles and percentage of population with at least 8th grade education in the United States with a correlation coefficient (R) of 0.624 and weighted average of 97.4%, a difference of 2.1%.
Immigrants from Sudan vs Polish 8th Grade

8th Grade Correlation Summary

MeasurementImmigrants from SudanPolish
Minimum84.2%95.0%
Maximum100.0%100.0%
Range15.8%5.0%
Mean95.8%98.7%
Median96.1%98.4%
Interquartile 25% (IQ1)94.9%97.9%
Interquartile 75% (IQ3)98.2%100.0%
Interquartile Range (IQR)3.3%2.1%
Standard Deviation (Sample)3.6%1.2%
Standard Deviation (Population)3.5%1.2%

Similar Demographics by 8th Grade

Demographics Similar to Immigrants from Sudan by 8th Grade

In terms of 8th grade, the demographic groups most similar to Immigrants from Sudan are Portuguese (95.5%, a difference of 0.010%), Hawaiian (95.5%, a difference of 0.020%), Immigrants from Bahamas (95.5%, a difference of 0.020%), Comanche (95.5%, a difference of 0.020%), and Immigrants from Lebanon (95.4%, a difference of 0.020%).
DemographicsRating | Rank8th Grade
Argentineans
22.2
/100
|
#200
Fair
95.5%
Immigrants | Argentina
20.6
/100
|
#201
Fair
95.5%
Apache
19.4
/100
|
#202
Poor
95.5%
Moroccans
17.4
/100
|
#203
Poor
95.5%
Hawaiians
16.7
/100
|
#204
Poor
95.5%
Immigrants | Bahamas
16.7
/100
|
#205
Poor
95.5%
Comanche
16.3
/100
|
#206
Poor
95.5%
Immigrants | Sudan
15.1
/100
|
#207
Poor
95.5%
Portuguese
14.3
/100
|
#208
Poor
95.5%
Immigrants | Lebanon
13.7
/100
|
#209
Poor
95.4%
Africans
13.6
/100
|
#210
Poor
95.4%
Immigrants | Morocco
12.4
/100
|
#211
Poor
95.4%
Immigrants | Pakistan
9.7
/100
|
#212
Tragic
95.4%
Laotians
9.0
/100
|
#213
Tragic
95.4%
Immigrants | Chile
9.0
/100
|
#214
Tragic
95.4%

Demographics Similar to Poles by 8th Grade

In terms of 8th grade, the demographic groups most similar to Poles are Slovene (97.5%, a difference of 0.030%), Swedish (97.4%, a difference of 0.030%), Alaskan Athabascan (97.3%, a difference of 0.10%), English (97.3%, a difference of 0.10%), and German (97.5%, a difference of 0.11%).
DemographicsRating | Rank8th Grade
Carpatho Rusyns
100.0
/100
|
#4
Exceptional
98.1%
Ottawa
100.0
/100
|
#5
Exceptional
97.9%
Dutch
100.0
/100
|
#6
Exceptional
97.7%
Norwegians
100.0
/100
|
#7
Exceptional
97.6%
Slovaks
100.0
/100
|
#8
Exceptional
97.6%
Germans
100.0
/100
|
#9
Exceptional
97.5%
Slovenes
100.0
/100
|
#10
Exceptional
97.5%
Poles
100.0
/100
|
#11
Exceptional
97.4%
Swedes
100.0
/100
|
#12
Exceptional
97.4%
Alaskan Athabascans
100.0
/100
|
#13
Exceptional
97.3%
English
100.0
/100
|
#14
Exceptional
97.3%
Pennsylvania Germans
100.0
/100
|
#15
Exceptional
97.3%
Tlingit-Haida
100.0
/100
|
#16
Exceptional
97.3%
Irish
100.0
/100
|
#17
Exceptional
97.3%
Lithuanians
100.0
/100
|
#18
Exceptional
97.3%