Immigrants from Czechoslovakia vs Polish 2 or more Vehicles in Household
COMPARE
Immigrants from Czechoslovakia
Polish
2 or more Vehicles in Household
2 or more Vehicles in Household Comparison
Immigrants from Czechoslovakia
Poles
54.1%
2 OR MORE VEHICLES IN HOUSEHOLD
9.4/ 100
METRIC RATING
214th/ 347
METRIC RANK
58.3%
2 OR MORE VEHICLES IN HOUSEHOLD
99.5/ 100
METRIC RATING
75th/ 347
METRIC RANK
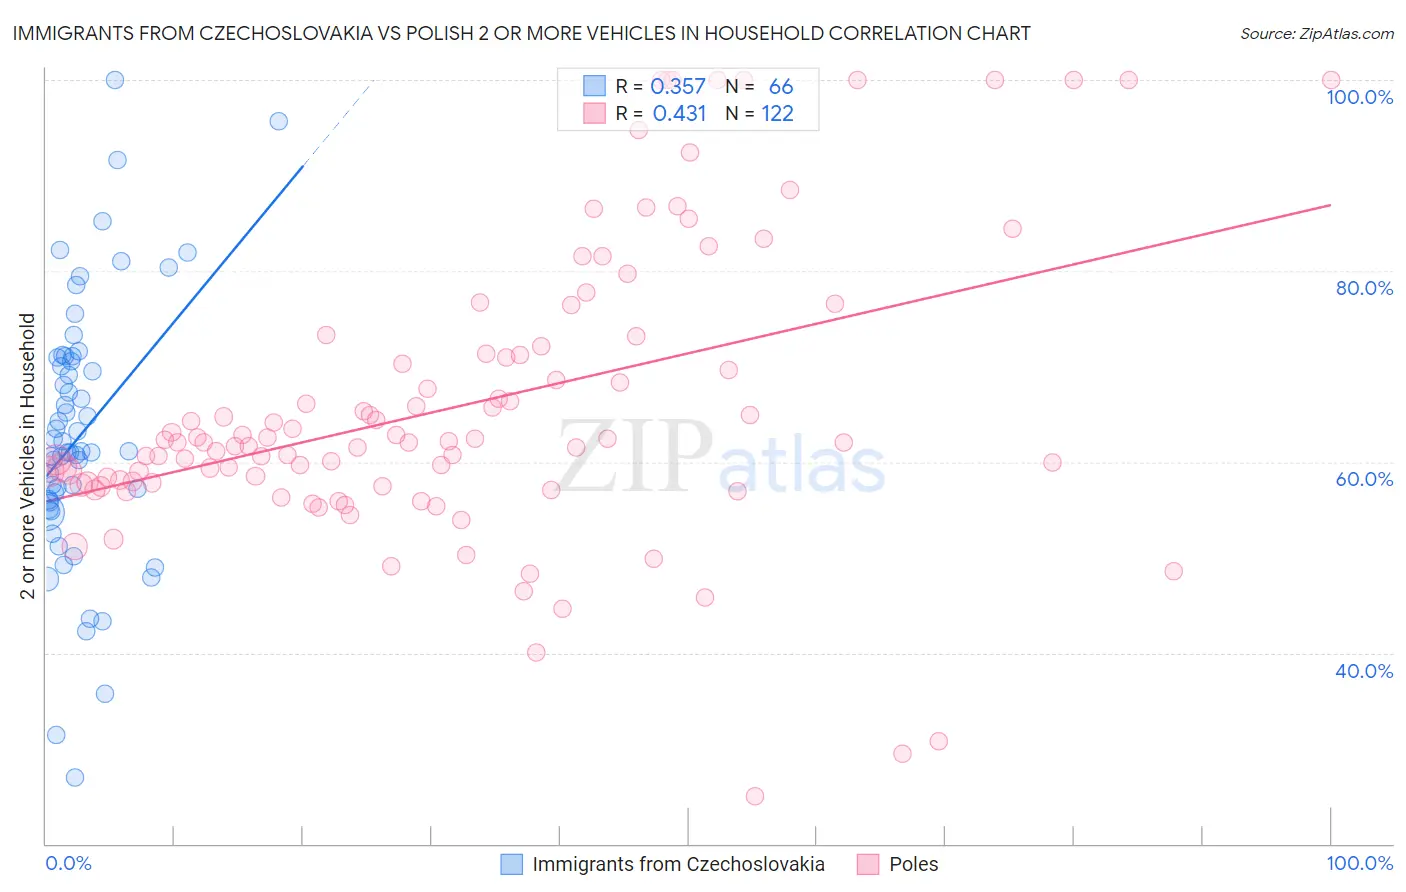
Immigrants from Czechoslovakia vs Polish 2 or more Vehicles in Household Correlation Chart
The statistical analysis conducted on geographies consisting of 195,452,090 people shows a mild positive correlation between the proportion of Immigrants from Czechoslovakia and percentage of households with 2 or more vehicles available in the United States with a correlation coefficient (R) of 0.357 and weighted average of 54.1%. Similarly, the statistical analysis conducted on geographies consisting of 560,032,572 people shows a moderate positive correlation between the proportion of Poles and percentage of households with 2 or more vehicles available in the United States with a correlation coefficient (R) of 0.431 and weighted average of 58.3%, a difference of 7.7%.
2 or more Vehicles in Household Correlation Summary
| Measurement | Immigrants from Czechoslovakia | Polish |
| Minimum | 27.0% | 25.0% |
| Maximum | 100.0% | 100.0% |
| Range | 73.0% | 75.0% |
| Mean | 62.9% | 65.9% |
| Median | 61.1% | 62.1% |
| Interquartile 25% (IQ1) | 55.8% | 57.8% |
| Interquartile 75% (IQ3) | 70.9% | 71.3% |
| Interquartile Range (IQR) | 15.1% | 13.5% |
| Standard Deviation (Sample) | 13.9% | 15.3% |
| Standard Deviation (Population) | 13.8% | 15.3% |
Similar Demographics by 2 or more Vehicles in Household
Demographics Similar to Immigrants from Czechoslovakia by 2 or more Vehicles in Household
In terms of 2 or more vehicles in household, the demographic groups most similar to Immigrants from Czechoslovakia are Aleut (54.1%, a difference of 0.010%), Guatemalan (54.1%, a difference of 0.020%), Immigrants from Western Asia (54.1%, a difference of 0.020%), Immigrants from Chile (54.2%, a difference of 0.18%), and Immigrants from Saudi Arabia (54.2%, a difference of 0.21%).
| Demographics | Rating | Rank | 2 or more Vehicles in Household |
| Turks | 13.0 /100 | #207 | Poor 54.3% |
| Egyptians | 12.0 /100 | #208 | Poor 54.3% |
| Immigrants | Bulgaria | 12.0 /100 | #209 | Poor 54.3% |
| Immigrants | Saudi Arabia | 11.3 /100 | #210 | Poor 54.2% |
| Immigrants | Hungary | 11.3 /100 | #211 | Poor 54.2% |
| Immigrants | Chile | 11.1 /100 | #212 | Poor 54.2% |
| Guatemalans | 9.6 /100 | #213 | Tragic 54.1% |
| Immigrants | Czechoslovakia | 9.4 /100 | #214 | Tragic 54.1% |
| Aleuts | 9.3 /100 | #215 | Tragic 54.1% |
| Immigrants | Western Asia | 9.3 /100 | #216 | Tragic 54.1% |
| Immigrants | Burma/Myanmar | 7.1 /100 | #217 | Tragic 53.9% |
| Immigrants | Argentina | 6.8 /100 | #218 | Tragic 53.9% |
| South American Indians | 6.5 /100 | #219 | Tragic 53.9% |
| Taiwanese | 6.3 /100 | #220 | Tragic 53.9% |
| Immigrants | Singapore | 6.3 /100 | #221 | Tragic 53.9% |
Demographics Similar to Poles by 2 or more Vehicles in Household
In terms of 2 or more vehicles in household, the demographic groups most similar to Poles are Creek (58.3%, a difference of 0.030%), Slovene (58.3%, a difference of 0.040%), Bolivian (58.3%, a difference of 0.080%), Immigrants from Afghanistan (58.3%, a difference of 0.080%), and Lithuanian (58.2%, a difference of 0.10%).
| Demographics | Rating | Rank | 2 or more Vehicles in Household |
| Canadians | 99.7 /100 | #68 | Exceptional 58.6% |
| Pennsylvania Germans | 99.7 /100 | #69 | Exceptional 58.5% |
| Italians | 99.6 /100 | #70 | Exceptional 58.4% |
| Bangladeshis | 99.6 /100 | #71 | Exceptional 58.4% |
| Austrians | 99.6 /100 | #72 | Exceptional 58.4% |
| Bolivians | 99.6 /100 | #73 | Exceptional 58.3% |
| Immigrants | Afghanistan | 99.6 /100 | #74 | Exceptional 58.3% |
| Poles | 99.5 /100 | #75 | Exceptional 58.3% |
| Creek | 99.5 /100 | #76 | Exceptional 58.3% |
| Slovenes | 99.5 /100 | #77 | Exceptional 58.3% |
| Lithuanians | 99.5 /100 | #78 | Exceptional 58.2% |
| Delaware | 99.4 /100 | #79 | Exceptional 58.2% |
| Immigrants | England | 99.3 /100 | #80 | Exceptional 58.1% |
| Immigrants | Iraq | 99.3 /100 | #81 | Exceptional 58.1% |
| Iranians | 99.3 /100 | #82 | Exceptional 58.1% |