French American Indian vs Polish 2 or more Vehicles in Household
COMPARE
French American Indian
Polish
2 or more Vehicles in Household
2 or more Vehicles in Household Comparison
French American Indians
Poles
55.5%
2 OR MORE VEHICLES IN HOUSEHOLD
56.7/ 100
METRIC RATING
168th/ 347
METRIC RANK
58.3%
2 OR MORE VEHICLES IN HOUSEHOLD
99.5/ 100
METRIC RATING
75th/ 347
METRIC RANK
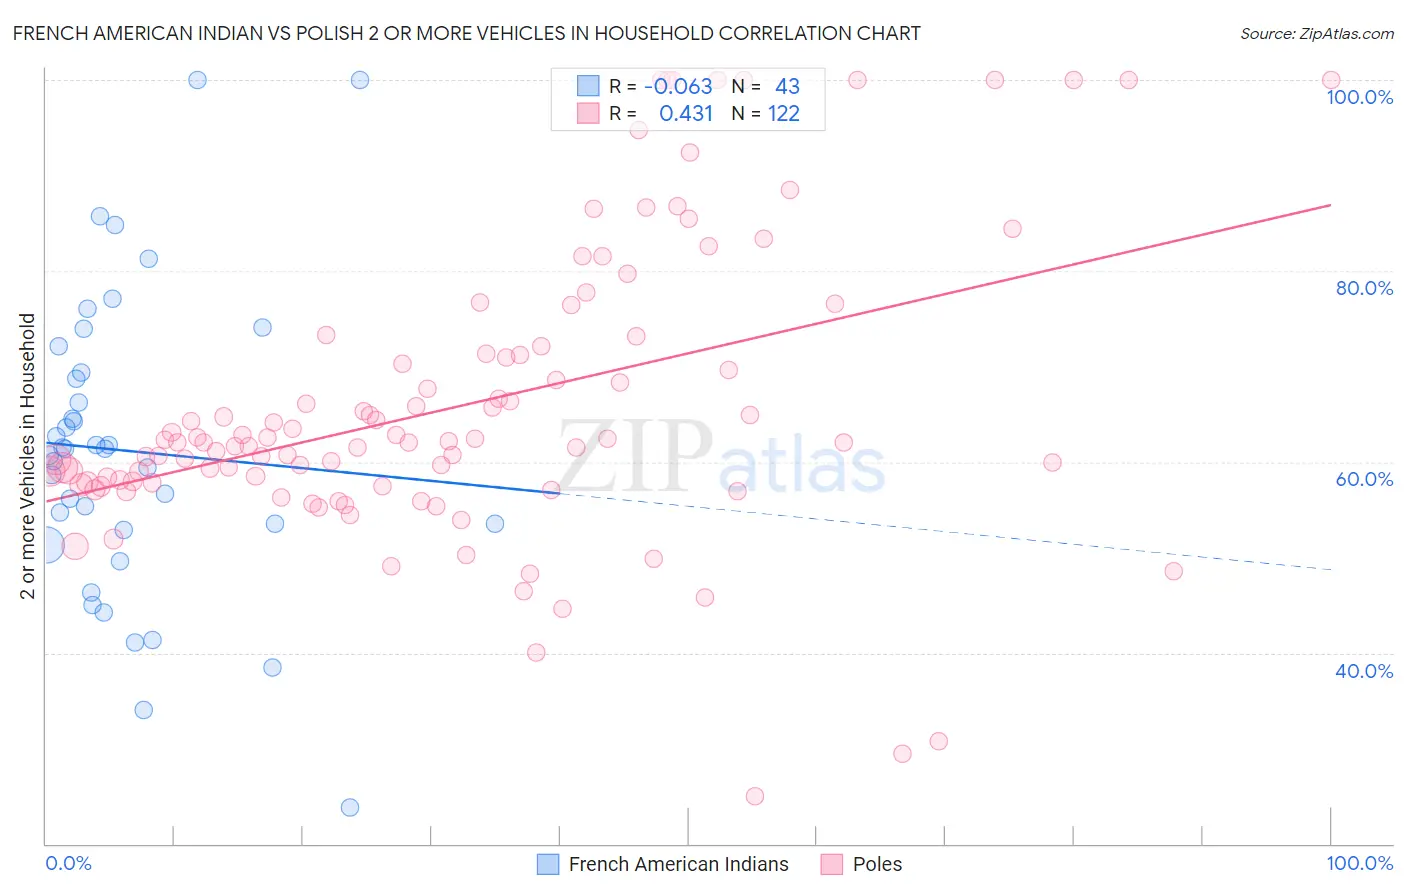
French American Indian vs Polish 2 or more Vehicles in Household Correlation Chart
The statistical analysis conducted on geographies consisting of 131,972,181 people shows a slight negative correlation between the proportion of French American Indians and percentage of households with 2 or more vehicles available in the United States with a correlation coefficient (R) of -0.063 and weighted average of 55.5%. Similarly, the statistical analysis conducted on geographies consisting of 560,032,572 people shows a moderate positive correlation between the proportion of Poles and percentage of households with 2 or more vehicles available in the United States with a correlation coefficient (R) of 0.431 and weighted average of 58.3%, a difference of 5.0%.
2 or more Vehicles in Household Correlation Summary
| Measurement | French American Indian | Polish |
| Minimum | 23.7% | 25.0% |
| Maximum | 100.0% | 100.0% |
| Range | 76.2% | 75.0% |
| Mean | 61.1% | 65.9% |
| Median | 61.3% | 62.1% |
| Interquartile 25% (IQ1) | 52.9% | 57.8% |
| Interquartile 75% (IQ3) | 69.4% | 71.3% |
| Interquartile Range (IQR) | 16.5% | 13.5% |
| Standard Deviation (Sample) | 15.8% | 15.3% |
| Standard Deviation (Population) | 15.6% | 15.3% |
Similar Demographics by 2 or more Vehicles in Household
Demographics Similar to French American Indians by 2 or more Vehicles in Household
In terms of 2 or more vehicles in household, the demographic groups most similar to French American Indians are Immigrants from Austria (55.5%, a difference of 0.010%), Romanian (55.5%, a difference of 0.030%), Kenyan (55.5%, a difference of 0.060%), Immigrants from Sri Lanka (55.5%, a difference of 0.070%), and Immigrants from Costa Rica (55.4%, a difference of 0.090%).
| Demographics | Rating | Rank | 2 or more Vehicles in Household |
| Colville | 61.1 /100 | #161 | Good 55.6% |
| German Russians | 60.9 /100 | #162 | Good 55.6% |
| Immigrants | Zimbabwe | 60.2 /100 | #163 | Good 55.6% |
| Dutch West Indians | 59.8 /100 | #164 | Average 55.6% |
| Immigrants | El Salvador | 59.4 /100 | #165 | Average 55.6% |
| Immigrants | Sri Lanka | 58.3 /100 | #166 | Average 55.5% |
| Kenyans | 58.1 /100 | #167 | Average 55.5% |
| French American Indians | 56.7 /100 | #168 | Average 55.5% |
| Immigrants | Austria | 56.3 /100 | #169 | Average 55.5% |
| Romanians | 55.8 /100 | #170 | Average 55.5% |
| Immigrants | Costa Rica | 54.4 /100 | #171 | Average 55.4% |
| Immigrants | Nicaragua | 51.6 /100 | #172 | Average 55.4% |
| Immigrants | Western Europe | 51.4 /100 | #173 | Average 55.4% |
| Navajo | 50.0 /100 | #174 | Average 55.3% |
| Immigrants | Denmark | 49.4 /100 | #175 | Average 55.3% |
Demographics Similar to Poles by 2 or more Vehicles in Household
In terms of 2 or more vehicles in household, the demographic groups most similar to Poles are Creek (58.3%, a difference of 0.030%), Slovene (58.3%, a difference of 0.040%), Bolivian (58.3%, a difference of 0.080%), Immigrants from Afghanistan (58.3%, a difference of 0.080%), and Lithuanian (58.2%, a difference of 0.10%).
| Demographics | Rating | Rank | 2 or more Vehicles in Household |
| Canadians | 99.7 /100 | #68 | Exceptional 58.6% |
| Pennsylvania Germans | 99.7 /100 | #69 | Exceptional 58.5% |
| Italians | 99.6 /100 | #70 | Exceptional 58.4% |
| Bangladeshis | 99.6 /100 | #71 | Exceptional 58.4% |
| Austrians | 99.6 /100 | #72 | Exceptional 58.4% |
| Bolivians | 99.6 /100 | #73 | Exceptional 58.3% |
| Immigrants | Afghanistan | 99.6 /100 | #74 | Exceptional 58.3% |
| Poles | 99.5 /100 | #75 | Exceptional 58.3% |
| Creek | 99.5 /100 | #76 | Exceptional 58.3% |
| Slovenes | 99.5 /100 | #77 | Exceptional 58.3% |
| Lithuanians | 99.5 /100 | #78 | Exceptional 58.2% |
| Delaware | 99.4 /100 | #79 | Exceptional 58.2% |
| Immigrants | England | 99.3 /100 | #80 | Exceptional 58.1% |
| Immigrants | Iraq | 99.3 /100 | #81 | Exceptional 58.1% |
| Iranians | 99.3 /100 | #82 | Exceptional 58.1% |