Icelander vs Polish 2 or more Vehicles in Household
COMPARE
Icelander
Polish
2 or more Vehicles in Household
2 or more Vehicles in Household Comparison
Icelanders
Poles
58.0%
2 OR MORE VEHICLES IN HOUSEHOLD
99.2/ 100
METRIC RATING
83rd/ 347
METRIC RANK
58.3%
2 OR MORE VEHICLES IN HOUSEHOLD
99.5/ 100
METRIC RATING
75th/ 347
METRIC RANK
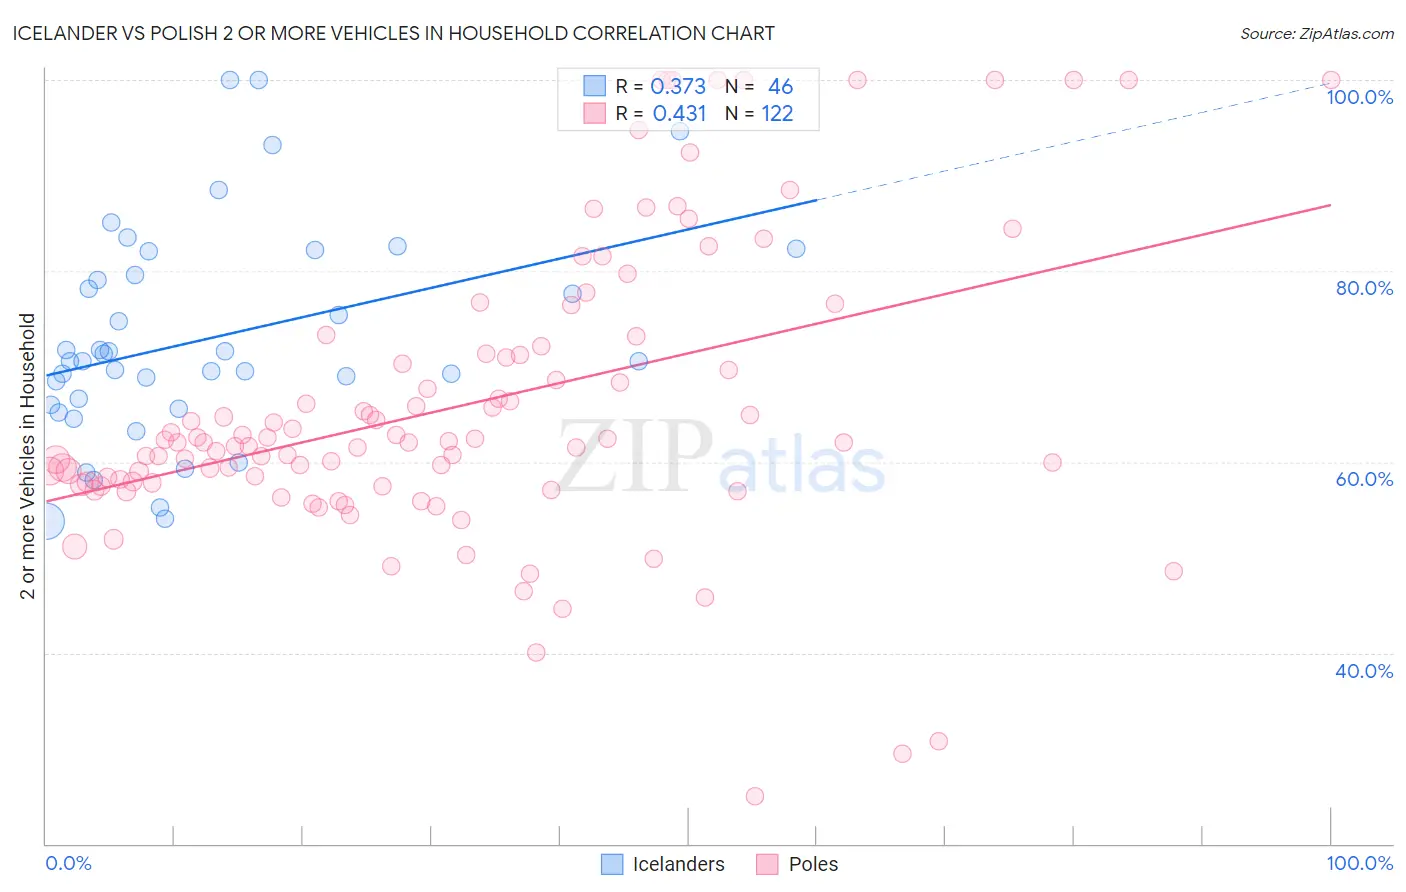
Icelander vs Polish 2 or more Vehicles in Household Correlation Chart
The statistical analysis conducted on geographies consisting of 159,625,716 people shows a mild positive correlation between the proportion of Icelanders and percentage of households with 2 or more vehicles available in the United States with a correlation coefficient (R) of 0.373 and weighted average of 58.0%. Similarly, the statistical analysis conducted on geographies consisting of 560,032,572 people shows a moderate positive correlation between the proportion of Poles and percentage of households with 2 or more vehicles available in the United States with a correlation coefficient (R) of 0.431 and weighted average of 58.3%, a difference of 0.45%.
2 or more Vehicles in Household Correlation Summary
| Measurement | Icelander | Polish |
| Minimum | 53.8% | 25.0% |
| Maximum | 100.0% | 100.0% |
| Range | 46.2% | 75.0% |
| Mean | 72.9% | 65.9% |
| Median | 70.6% | 62.1% |
| Interquartile 25% (IQ1) | 66.0% | 57.8% |
| Interquartile 75% (IQ3) | 79.6% | 71.3% |
| Interquartile Range (IQR) | 13.6% | 13.5% |
| Standard Deviation (Sample) | 11.2% | 15.3% |
| Standard Deviation (Population) | 11.1% | 15.3% |
Demographics Similar to Icelanders and Poles by 2 or more Vehicles in Household
In terms of 2 or more vehicles in household, the demographic groups most similar to Icelanders are Maltese (58.0%, a difference of 0.030%), Iranian (58.1%, a difference of 0.040%), Slovak (58.0%, a difference of 0.080%), Potawatomi (58.0%, a difference of 0.11%), and Immigrants from Iraq (58.1%, a difference of 0.12%). Similarly, the demographic groups most similar to Poles are Creek (58.3%, a difference of 0.030%), Slovene (58.3%, a difference of 0.040%), Bolivian (58.3%, a difference of 0.080%), Immigrants from Afghanistan (58.3%, a difference of 0.080%), and Lithuanian (58.2%, a difference of 0.10%).
| Demographics | Rating | Rank | 2 or more Vehicles in Household |
| Pennsylvania Germans | 99.7 /100 | #69 | Exceptional 58.5% |
| Italians | 99.6 /100 | #70 | Exceptional 58.4% |
| Bangladeshis | 99.6 /100 | #71 | Exceptional 58.4% |
| Austrians | 99.6 /100 | #72 | Exceptional 58.4% |
| Bolivians | 99.6 /100 | #73 | Exceptional 58.3% |
| Immigrants | Afghanistan | 99.6 /100 | #74 | Exceptional 58.3% |
| Poles | 99.5 /100 | #75 | Exceptional 58.3% |
| Creek | 99.5 /100 | #76 | Exceptional 58.3% |
| Slovenes | 99.5 /100 | #77 | Exceptional 58.3% |
| Lithuanians | 99.5 /100 | #78 | Exceptional 58.2% |
| Delaware | 99.4 /100 | #79 | Exceptional 58.2% |
| Immigrants | England | 99.3 /100 | #80 | Exceptional 58.1% |
| Immigrants | Iraq | 99.3 /100 | #81 | Exceptional 58.1% |
| Iranians | 99.3 /100 | #82 | Exceptional 58.1% |
| Icelanders | 99.2 /100 | #83 | Exceptional 58.0% |
| Maltese | 99.2 /100 | #84 | Exceptional 58.0% |
| Slovaks | 99.2 /100 | #85 | Exceptional 58.0% |
| Potawatomi | 99.1 /100 | #86 | Exceptional 58.0% |
| Thais | 99.1 /100 | #87 | Exceptional 57.9% |
| Immigrants | Iran | 99.1 /100 | #88 | Exceptional 57.9% |
| Immigrants | Germany | 99.0 /100 | #89 | Exceptional 57.9% |