Senegalese vs Polish 2 or more Vehicles in Household
COMPARE
Senegalese
Polish
2 or more Vehicles in Household
2 or more Vehicles in Household Comparison
Senegalese
Poles
44.2%
2 OR MORE VEHICLES IN HOUSEHOLD
0.0/ 100
METRIC RATING
322nd/ 347
METRIC RANK
58.3%
2 OR MORE VEHICLES IN HOUSEHOLD
99.5/ 100
METRIC RATING
75th/ 347
METRIC RANK
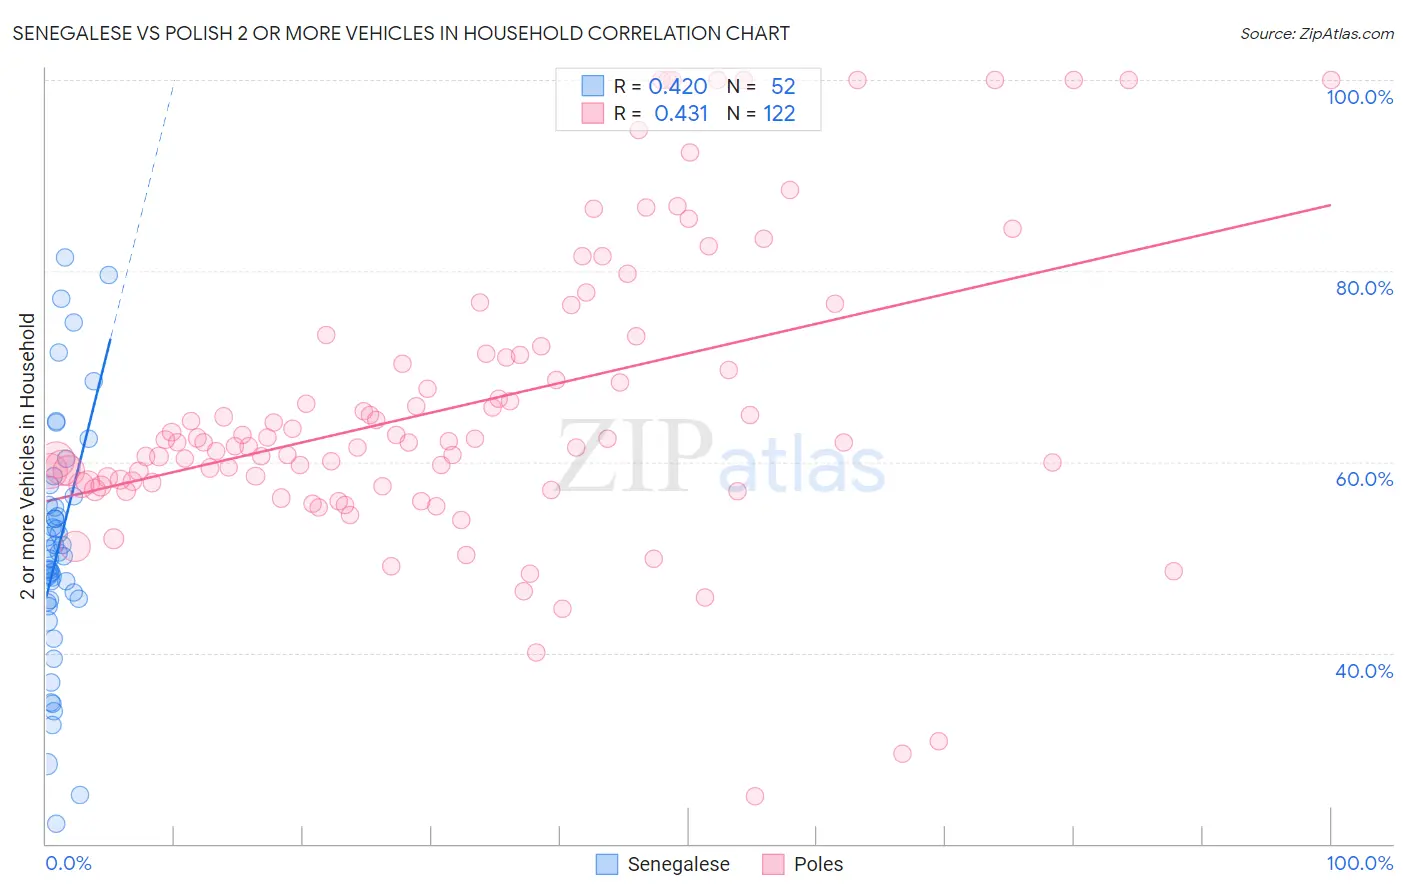
Senegalese vs Polish 2 or more Vehicles in Household Correlation Chart
The statistical analysis conducted on geographies consisting of 78,083,411 people shows a moderate positive correlation between the proportion of Senegalese and percentage of households with 2 or more vehicles available in the United States with a correlation coefficient (R) of 0.420 and weighted average of 44.2%. Similarly, the statistical analysis conducted on geographies consisting of 560,032,572 people shows a moderate positive correlation between the proportion of Poles and percentage of households with 2 or more vehicles available in the United States with a correlation coefficient (R) of 0.431 and weighted average of 58.3%, a difference of 31.8%.
2 or more Vehicles in Household Correlation Summary
| Measurement | Senegalese | Polish |
| Minimum | 22.1% | 25.0% |
| Maximum | 81.4% | 100.0% |
| Range | 59.3% | 75.0% |
| Mean | 51.0% | 65.9% |
| Median | 50.3% | 62.1% |
| Interquartile 25% (IQ1) | 45.5% | 57.8% |
| Interquartile 75% (IQ3) | 56.0% | 71.3% |
| Interquartile Range (IQR) | 10.5% | 13.5% |
| Standard Deviation (Sample) | 12.8% | 15.3% |
| Standard Deviation (Population) | 12.7% | 15.3% |
Similar Demographics by 2 or more Vehicles in Household
Demographics Similar to Senegalese by 2 or more Vehicles in Household
In terms of 2 or more vehicles in household, the demographic groups most similar to Senegalese are Immigrants from Caribbean (44.2%, a difference of 0.020%), Immigrants from Jamaica (44.5%, a difference of 0.55%), Immigrants from Cabo Verde (43.3%, a difference of 2.1%), Immigrants from West Indies (43.1%, a difference of 2.6%), and Immigrants from Senegal (43.0%, a difference of 2.8%).
| Demographics | Rating | Rank | 2 or more Vehicles in Household |
| Puerto Ricans | 0.0 /100 | #315 | Tragic 47.1% |
| Cape Verdeans | 0.0 /100 | #316 | Tragic 46.8% |
| Immigrants | Haiti | 0.0 /100 | #317 | Tragic 46.5% |
| Immigrants | Albania | 0.0 /100 | #318 | Tragic 46.0% |
| Jamaicans | 0.0 /100 | #319 | Tragic 45.8% |
| Soviet Union | 0.0 /100 | #320 | Tragic 45.7% |
| Immigrants | Jamaica | 0.0 /100 | #321 | Tragic 44.5% |
| Senegalese | 0.0 /100 | #322 | Tragic 44.2% |
| Immigrants | Caribbean | 0.0 /100 | #323 | Tragic 44.2% |
| Immigrants | Cabo Verde | 0.0 /100 | #324 | Tragic 43.3% |
| Immigrants | West Indies | 0.0 /100 | #325 | Tragic 43.1% |
| Immigrants | Senegal | 0.0 /100 | #326 | Tragic 43.0% |
| Immigrants | Yemen | 0.0 /100 | #327 | Tragic 42.8% |
| Inupiat | 0.0 /100 | #328 | Tragic 42.6% |
| Ecuadorians | 0.0 /100 | #329 | Tragic 42.0% |
Demographics Similar to Poles by 2 or more Vehicles in Household
In terms of 2 or more vehicles in household, the demographic groups most similar to Poles are Creek (58.3%, a difference of 0.030%), Slovene (58.3%, a difference of 0.040%), Bolivian (58.3%, a difference of 0.080%), Immigrants from Afghanistan (58.3%, a difference of 0.080%), and Lithuanian (58.2%, a difference of 0.10%).
| Demographics | Rating | Rank | 2 or more Vehicles in Household |
| Canadians | 99.7 /100 | #68 | Exceptional 58.6% |
| Pennsylvania Germans | 99.7 /100 | #69 | Exceptional 58.5% |
| Italians | 99.6 /100 | #70 | Exceptional 58.4% |
| Bangladeshis | 99.6 /100 | #71 | Exceptional 58.4% |
| Austrians | 99.6 /100 | #72 | Exceptional 58.4% |
| Bolivians | 99.6 /100 | #73 | Exceptional 58.3% |
| Immigrants | Afghanistan | 99.6 /100 | #74 | Exceptional 58.3% |
| Poles | 99.5 /100 | #75 | Exceptional 58.3% |
| Creek | 99.5 /100 | #76 | Exceptional 58.3% |
| Slovenes | 99.5 /100 | #77 | Exceptional 58.3% |
| Lithuanians | 99.5 /100 | #78 | Exceptional 58.2% |
| Delaware | 99.4 /100 | #79 | Exceptional 58.2% |
| Immigrants | England | 99.3 /100 | #80 | Exceptional 58.1% |
| Immigrants | Iraq | 99.3 /100 | #81 | Exceptional 58.1% |
| Iranians | 99.3 /100 | #82 | Exceptional 58.1% |