Immigrants from South America vs Norwegian 2 or more Vehicles in Household
COMPARE
Immigrants from South America
Norwegian
2 or more Vehicles in Household
2 or more Vehicles in Household Comparison
Immigrants from South America
Norwegians
50.2%
2 OR MORE VEHICLES IN HOUSEHOLD
0.0/ 100
METRIC RATING
302nd/ 347
METRIC RANK
62.8%
2 OR MORE VEHICLES IN HOUSEHOLD
100.0/ 100
METRIC RATING
4th/ 347
METRIC RANK
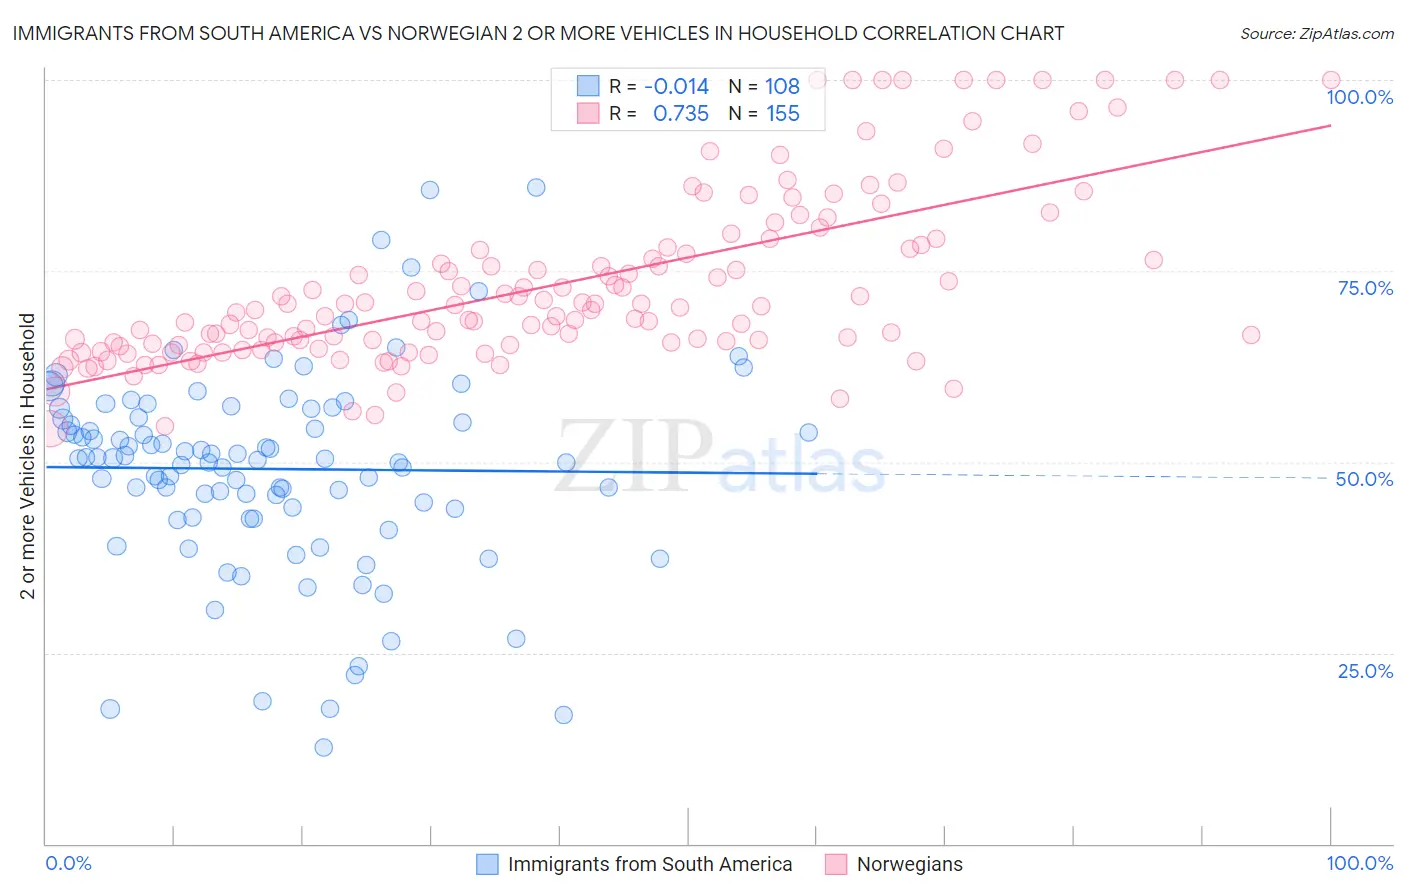
Immigrants from South America vs Norwegian 2 or more Vehicles in Household Correlation Chart
The statistical analysis conducted on geographies consisting of 486,071,920 people shows no correlation between the proportion of Immigrants from South America and percentage of households with 2 or more vehicles available in the United States with a correlation coefficient (R) of -0.014 and weighted average of 50.2%. Similarly, the statistical analysis conducted on geographies consisting of 532,963,980 people shows a strong positive correlation between the proportion of Norwegians and percentage of households with 2 or more vehicles available in the United States with a correlation coefficient (R) of 0.735 and weighted average of 62.8%, a difference of 25.2%.
2 or more Vehicles in Household Correlation Summary
| Measurement | Immigrants from South America | Norwegian |
| Minimum | 12.6% | 54.4% |
| Maximum | 86.0% | 100.0% |
| Range | 73.3% | 45.6% |
| Mean | 49.1% | 73.2% |
| Median | 50.5% | 69.9% |
| Interquartile 25% (IQ1) | 43.3% | 65.3% |
| Interquartile 75% (IQ3) | 56.5% | 78.0% |
| Interquartile Range (IQR) | 13.2% | 12.7% |
| Standard Deviation (Sample) | 13.3% | 11.3% |
| Standard Deviation (Population) | 13.2% | 11.3% |
Similar Demographics by 2 or more Vehicles in Household
Demographics Similar to Immigrants from South America by 2 or more Vehicles in Household
In terms of 2 or more vehicles in household, the demographic groups most similar to Immigrants from South America are Immigrants from Greece (50.2%, a difference of 0.060%), Immigrants from Russia (50.3%, a difference of 0.24%), Immigrants from Morocco (50.3%, a difference of 0.28%), Paraguayan (50.3%, a difference of 0.31%), and Tohono O'odham (50.0%, a difference of 0.37%).
| Demographics | Rating | Rank | 2 or more Vehicles in Household |
| Cypriots | 0.0 /100 | #295 | Tragic 50.6% |
| Immigrants | Somalia | 0.0 /100 | #296 | Tragic 50.5% |
| Immigrants | Spain | 0.0 /100 | #297 | Tragic 50.4% |
| Paraguayans | 0.0 /100 | #298 | Tragic 50.3% |
| Immigrants | Morocco | 0.0 /100 | #299 | Tragic 50.3% |
| Immigrants | Russia | 0.0 /100 | #300 | Tragic 50.3% |
| Immigrants | Greece | 0.0 /100 | #301 | Tragic 50.2% |
| Immigrants | South America | 0.0 /100 | #302 | Tragic 50.2% |
| Tohono O'odham | 0.0 /100 | #303 | Tragic 50.0% |
| Immigrants | Belize | 0.0 /100 | #304 | Tragic 49.9% |
| Immigrants | Western Africa | 0.0 /100 | #305 | Tragic 49.4% |
| Immigrants | Israel | 0.0 /100 | #306 | Tragic 49.2% |
| Hopi | 0.0 /100 | #307 | Tragic 49.0% |
| Albanians | 0.0 /100 | #308 | Tragic 49.0% |
| Moroccans | 0.0 /100 | #309 | Tragic 48.8% |
Demographics Similar to Norwegians by 2 or more Vehicles in Household
In terms of 2 or more vehicles in household, the demographic groups most similar to Norwegians are Danish (63.3%, a difference of 0.69%), Immigrants from Fiji (62.3%, a difference of 0.87%), Tongan (63.5%, a difference of 1.1%), Scandinavian (62.1%, a difference of 1.2%), and Puget Sound Salish (62.1%, a difference of 1.3%).
| Demographics | Rating | Rank | 2 or more Vehicles in Household |
| Yakama | 100.0 /100 | #1 | Exceptional 64.9% |
| Tongans | 100.0 /100 | #2 | Exceptional 63.5% |
| Danes | 100.0 /100 | #3 | Exceptional 63.3% |
| Norwegians | 100.0 /100 | #4 | Exceptional 62.8% |
| Immigrants | Fiji | 100.0 /100 | #5 | Exceptional 62.3% |
| Scandinavians | 100.0 /100 | #6 | Exceptional 62.1% |
| Puget Sound Salish | 100.0 /100 | #7 | Exceptional 62.1% |
| English | 100.0 /100 | #8 | Exceptional 61.9% |
| Swedes | 100.0 /100 | #9 | Exceptional 61.8% |
| Mexicans | 100.0 /100 | #10 | Exceptional 61.7% |
| Dutch | 100.0 /100 | #11 | Exceptional 61.6% |
| Germans | 100.0 /100 | #12 | Exceptional 61.6% |
| Samoans | 100.0 /100 | #13 | Exceptional 61.5% |
| Czechs | 100.0 /100 | #14 | Exceptional 61.5% |
| Nepalese | 100.0 /100 | #15 | Exceptional 61.4% |