Immigrants from South America vs German Russian 2 or more Vehicles in Household
COMPARE
Immigrants from South America
German Russian
2 or more Vehicles in Household
2 or more Vehicles in Household Comparison
Immigrants from South America
German Russians
50.2%
2 OR MORE VEHICLES IN HOUSEHOLD
0.0/ 100
METRIC RATING
302nd/ 347
METRIC RANK
55.6%
2 OR MORE VEHICLES IN HOUSEHOLD
60.9/ 100
METRIC RATING
162nd/ 347
METRIC RANK
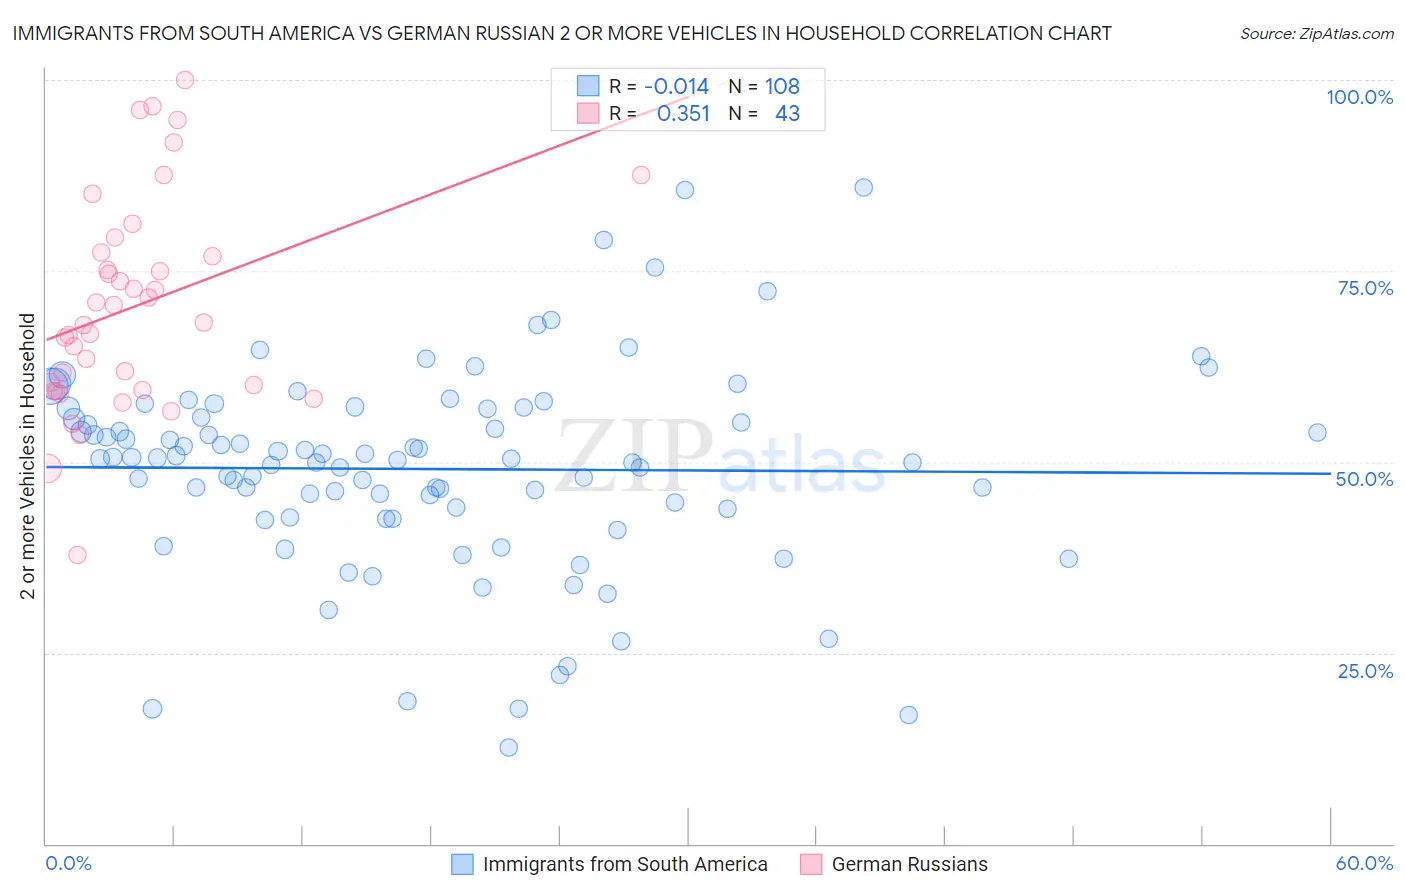
Immigrants from South America vs German Russian 2 or more Vehicles in Household Correlation Chart
The statistical analysis conducted on geographies consisting of 486,071,920 people shows no correlation between the proportion of Immigrants from South America and percentage of households with 2 or more vehicles available in the United States with a correlation coefficient (R) of -0.014 and weighted average of 50.2%. Similarly, the statistical analysis conducted on geographies consisting of 96,451,375 people shows a mild positive correlation between the proportion of German Russians and percentage of households with 2 or more vehicles available in the United States with a correlation coefficient (R) of 0.351 and weighted average of 55.6%, a difference of 10.8%.
2 or more Vehicles in Household Correlation Summary
| Measurement | Immigrants from South America | German Russian |
| Minimum | 12.6% | 37.7% |
| Maximum | 86.0% | 100.0% |
| Range | 73.3% | 62.3% |
| Mean | 49.1% | 70.3% |
| Median | 50.5% | 68.2% |
| Interquartile 25% (IQ1) | 43.3% | 59.5% |
| Interquartile 75% (IQ3) | 56.5% | 77.5% |
| Interquartile Range (IQR) | 13.2% | 18.0% |
| Standard Deviation (Sample) | 13.3% | 13.8% |
| Standard Deviation (Population) | 13.2% | 13.6% |
Similar Demographics by 2 or more Vehicles in Household
Demographics Similar to Immigrants from South America by 2 or more Vehicles in Household
In terms of 2 or more vehicles in household, the demographic groups most similar to Immigrants from South America are Immigrants from Greece (50.2%, a difference of 0.060%), Immigrants from Russia (50.3%, a difference of 0.24%), Immigrants from Morocco (50.3%, a difference of 0.28%), Paraguayan (50.3%, a difference of 0.31%), and Tohono O'odham (50.0%, a difference of 0.37%).
| Demographics | Rating | Rank | 2 or more Vehicles in Household |
| Cypriots | 0.0 /100 | #295 | Tragic 50.6% |
| Immigrants | Somalia | 0.0 /100 | #296 | Tragic 50.5% |
| Immigrants | Spain | 0.0 /100 | #297 | Tragic 50.4% |
| Paraguayans | 0.0 /100 | #298 | Tragic 50.3% |
| Immigrants | Morocco | 0.0 /100 | #299 | Tragic 50.3% |
| Immigrants | Russia | 0.0 /100 | #300 | Tragic 50.3% |
| Immigrants | Greece | 0.0 /100 | #301 | Tragic 50.2% |
| Immigrants | South America | 0.0 /100 | #302 | Tragic 50.2% |
| Tohono O'odham | 0.0 /100 | #303 | Tragic 50.0% |
| Immigrants | Belize | 0.0 /100 | #304 | Tragic 49.9% |
| Immigrants | Western Africa | 0.0 /100 | #305 | Tragic 49.4% |
| Immigrants | Israel | 0.0 /100 | #306 | Tragic 49.2% |
| Hopi | 0.0 /100 | #307 | Tragic 49.0% |
| Albanians | 0.0 /100 | #308 | Tragic 49.0% |
| Moroccans | 0.0 /100 | #309 | Tragic 48.8% |
Demographics Similar to German Russians by 2 or more Vehicles in Household
In terms of 2 or more vehicles in household, the demographic groups most similar to German Russians are Colville (55.6%, a difference of 0.010%), Immigrants from Zimbabwe (55.6%, a difference of 0.030%), Dutch West Indian (55.6%, a difference of 0.040%), Immigrants from El Salvador (55.6%, a difference of 0.060%), and Immigrants from Sri Lanka (55.5%, a difference of 0.10%).
| Demographics | Rating | Rank | 2 or more Vehicles in Household |
| Immigrants | Venezuela | 70.7 /100 | #155 | Good 55.8% |
| Immigrants | Lithuania | 70.4 /100 | #156 | Good 55.8% |
| Immigrants | Kuwait | 70.2 /100 | #157 | Good 55.8% |
| Tlingit-Haida | 68.5 /100 | #158 | Good 55.8% |
| Paiute | 68.0 /100 | #159 | Good 55.8% |
| Crow | 67.0 /100 | #160 | Good 55.7% |
| Colville | 61.1 /100 | #161 | Good 55.6% |
| German Russians | 60.9 /100 | #162 | Good 55.6% |
| Immigrants | Zimbabwe | 60.2 /100 | #163 | Good 55.6% |
| Dutch West Indians | 59.8 /100 | #164 | Average 55.6% |
| Immigrants | El Salvador | 59.4 /100 | #165 | Average 55.6% |
| Immigrants | Sri Lanka | 58.3 /100 | #166 | Average 55.5% |
| Kenyans | 58.1 /100 | #167 | Average 55.5% |
| French American Indians | 56.7 /100 | #168 | Average 55.5% |
| Immigrants | Austria | 56.3 /100 | #169 | Average 55.5% |