Immigrants from South America vs Sioux 2 or more Vehicles in Household
COMPARE
Immigrants from South America
Sioux
2 or more Vehicles in Household
2 or more Vehicles in Household Comparison
Immigrants from South America
Sioux
50.2%
2 OR MORE VEHICLES IN HOUSEHOLD
0.0/ 100
METRIC RATING
302nd/ 347
METRIC RANK
56.8%
2 OR MORE VEHICLES IN HOUSEHOLD
93.8/ 100
METRIC RATING
121st/ 347
METRIC RANK
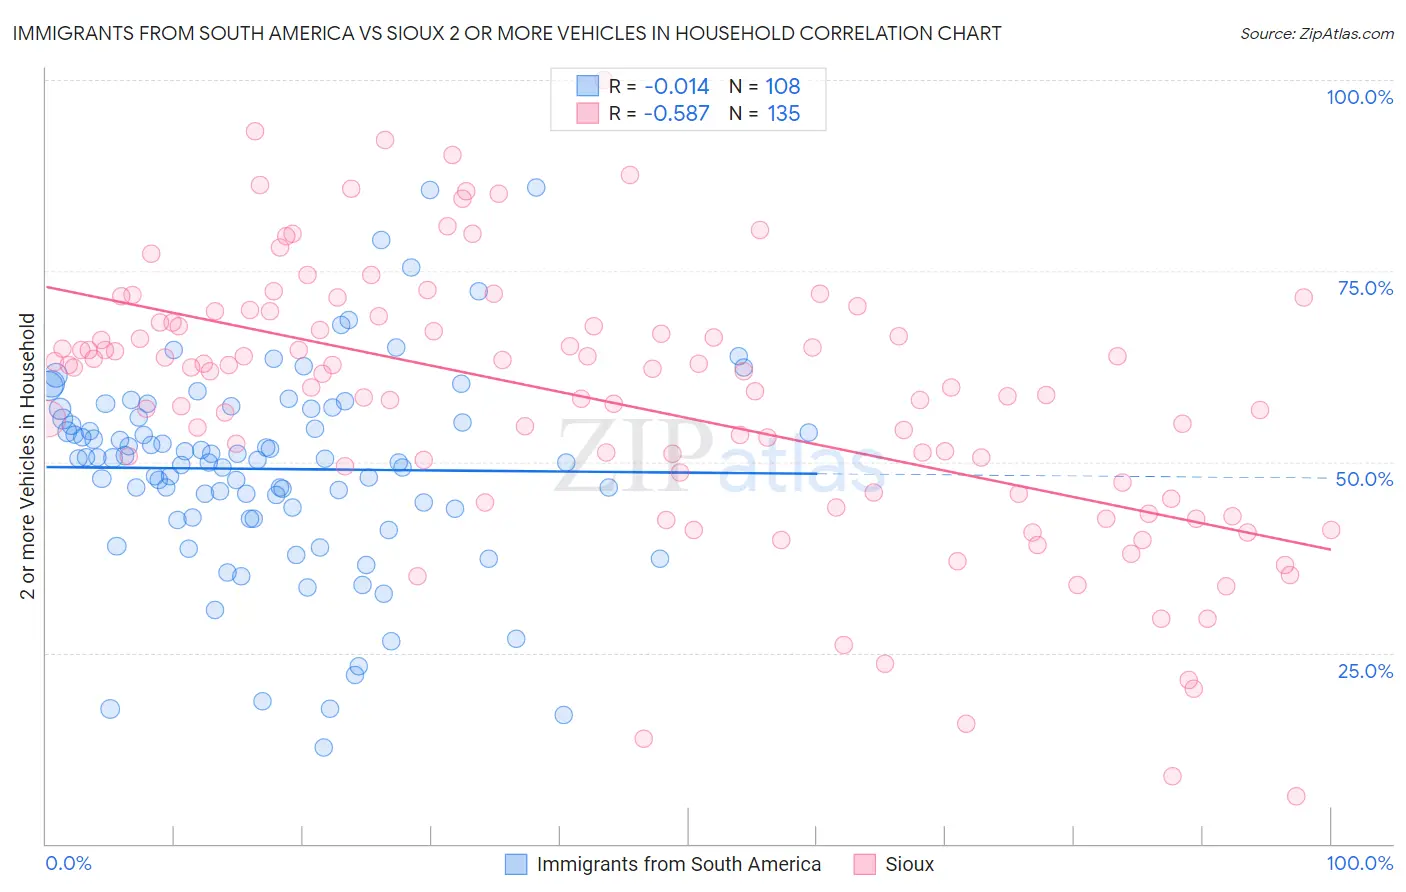
Immigrants from South America vs Sioux 2 or more Vehicles in Household Correlation Chart
The statistical analysis conducted on geographies consisting of 486,071,920 people shows no correlation between the proportion of Immigrants from South America and percentage of households with 2 or more vehicles available in the United States with a correlation coefficient (R) of -0.014 and weighted average of 50.2%. Similarly, the statistical analysis conducted on geographies consisting of 234,124,703 people shows a substantial negative correlation between the proportion of Sioux and percentage of households with 2 or more vehicles available in the United States with a correlation coefficient (R) of -0.587 and weighted average of 56.8%, a difference of 13.3%.
2 or more Vehicles in Household Correlation Summary
| Measurement | Immigrants from South America | Sioux |
| Minimum | 12.6% | 6.2% |
| Maximum | 86.0% | 100.0% |
| Range | 73.3% | 93.8% |
| Mean | 49.1% | 57.9% |
| Median | 50.5% | 61.8% |
| Interquartile 25% (IQ1) | 43.3% | 46.0% |
| Interquartile 75% (IQ3) | 56.5% | 68.2% |
| Interquartile Range (IQR) | 13.2% | 22.2% |
| Standard Deviation (Sample) | 13.3% | 17.6% |
| Standard Deviation (Population) | 13.2% | 17.5% |
Similar Demographics by 2 or more Vehicles in Household
Demographics Similar to Immigrants from South America by 2 or more Vehicles in Household
In terms of 2 or more vehicles in household, the demographic groups most similar to Immigrants from South America are Immigrants from Greece (50.2%, a difference of 0.060%), Immigrants from Russia (50.3%, a difference of 0.24%), Immigrants from Morocco (50.3%, a difference of 0.28%), Paraguayan (50.3%, a difference of 0.31%), and Tohono O'odham (50.0%, a difference of 0.37%).
| Demographics | Rating | Rank | 2 or more Vehicles in Household |
| Cypriots | 0.0 /100 | #295 | Tragic 50.6% |
| Immigrants | Somalia | 0.0 /100 | #296 | Tragic 50.5% |
| Immigrants | Spain | 0.0 /100 | #297 | Tragic 50.4% |
| Paraguayans | 0.0 /100 | #298 | Tragic 50.3% |
| Immigrants | Morocco | 0.0 /100 | #299 | Tragic 50.3% |
| Immigrants | Russia | 0.0 /100 | #300 | Tragic 50.3% |
| Immigrants | Greece | 0.0 /100 | #301 | Tragic 50.2% |
| Immigrants | South America | 0.0 /100 | #302 | Tragic 50.2% |
| Tohono O'odham | 0.0 /100 | #303 | Tragic 50.0% |
| Immigrants | Belize | 0.0 /100 | #304 | Tragic 49.9% |
| Immigrants | Western Africa | 0.0 /100 | #305 | Tragic 49.4% |
| Immigrants | Israel | 0.0 /100 | #306 | Tragic 49.2% |
| Hopi | 0.0 /100 | #307 | Tragic 49.0% |
| Albanians | 0.0 /100 | #308 | Tragic 49.0% |
| Moroccans | 0.0 /100 | #309 | Tragic 48.8% |
Demographics Similar to Sioux by 2 or more Vehicles in Household
In terms of 2 or more vehicles in household, the demographic groups most similar to Sioux are Costa Rican (56.9%, a difference of 0.17%), Immigrants from South Africa (56.7%, a difference of 0.20%), Native/Alaskan (57.0%, a difference of 0.21%), Asian (57.0%, a difference of 0.24%), and Australian (56.7%, a difference of 0.29%).
| Demographics | Rating | Rank | 2 or more Vehicles in Household |
| Immigrants | Lebanon | 96.8 /100 | #114 | Exceptional 57.2% |
| Chippewa | 96.6 /100 | #115 | Exceptional 57.2% |
| Immigrants | Jordan | 96.6 /100 | #116 | Exceptional 57.2% |
| Iraqis | 95.8 /100 | #117 | Exceptional 57.1% |
| Asians | 95.1 /100 | #118 | Exceptional 57.0% |
| Natives/Alaskans | 95.0 /100 | #119 | Exceptional 57.0% |
| Costa Ricans | 94.7 /100 | #120 | Exceptional 56.9% |
| Sioux | 93.8 /100 | #121 | Exceptional 56.8% |
| Immigrants | South Africa | 92.5 /100 | #122 | Exceptional 56.7% |
| Australians | 91.8 /100 | #123 | Exceptional 56.7% |
| New Zealanders | 91.8 /100 | #124 | Exceptional 56.7% |
| Tsimshian | 91.6 /100 | #125 | Exceptional 56.7% |
| Estonians | 90.9 /100 | #126 | Exceptional 56.6% |
| Immigrants | Thailand | 90.7 /100 | #127 | Exceptional 56.6% |
| Immigrants | South Central Asia | 90.5 /100 | #128 | Exceptional 56.6% |