Immigrants from Jordan vs Norwegian 2 or more Vehicles in Household
COMPARE
Immigrants from Jordan
Norwegian
2 or more Vehicles in Household
2 or more Vehicles in Household Comparison
Immigrants from Jordan
Norwegians
57.2%
2 OR MORE VEHICLES IN HOUSEHOLD
96.6/ 100
METRIC RATING
116th/ 347
METRIC RANK
62.8%
2 OR MORE VEHICLES IN HOUSEHOLD
100.0/ 100
METRIC RATING
4th/ 347
METRIC RANK
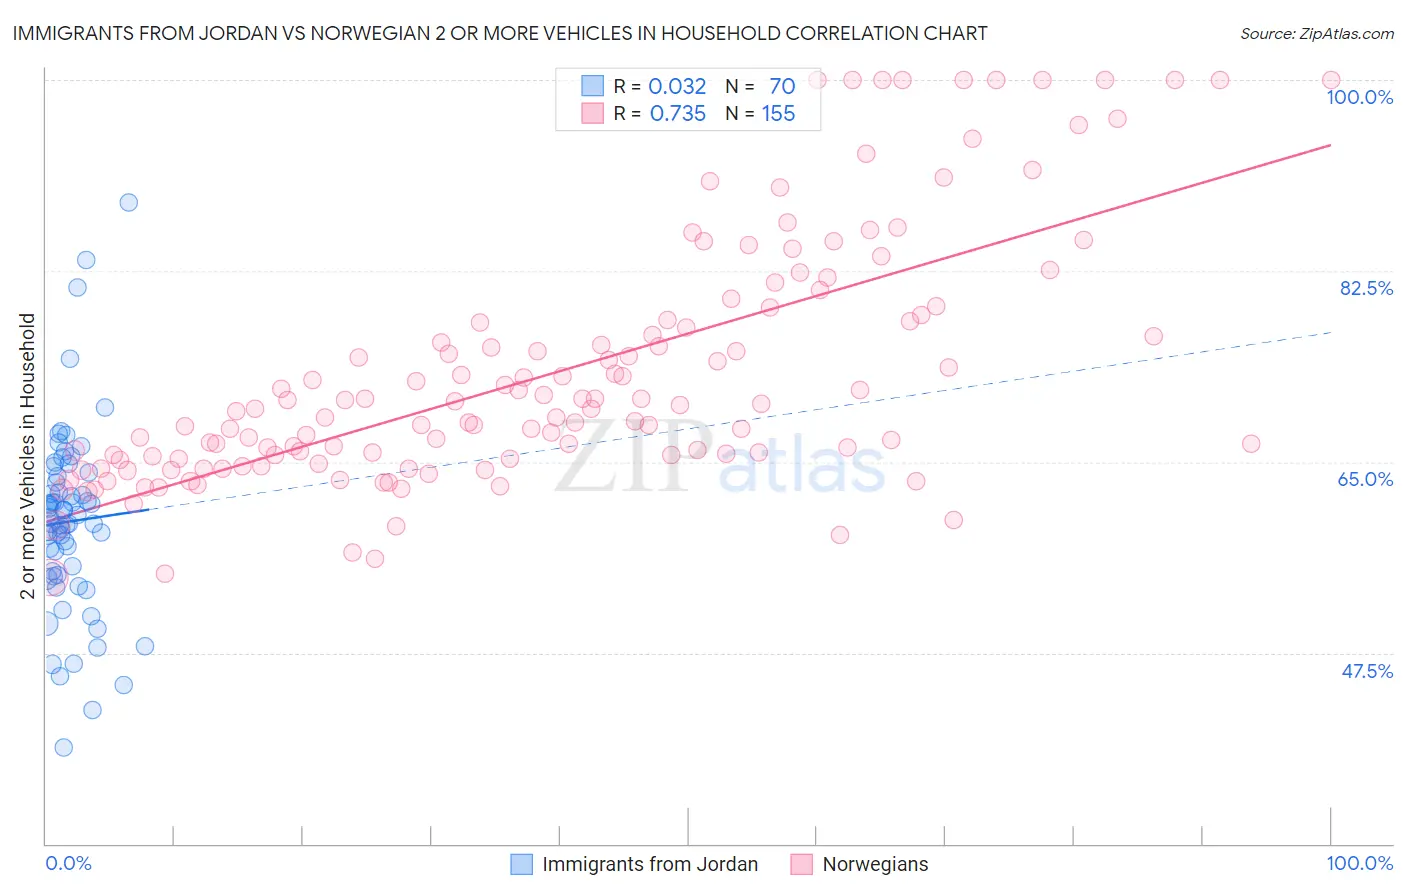
Immigrants from Jordan vs Norwegian 2 or more Vehicles in Household Correlation Chart
The statistical analysis conducted on geographies consisting of 181,252,999 people shows no correlation between the proportion of Immigrants from Jordan and percentage of households with 2 or more vehicles available in the United States with a correlation coefficient (R) of 0.032 and weighted average of 57.2%. Similarly, the statistical analysis conducted on geographies consisting of 532,963,980 people shows a strong positive correlation between the proportion of Norwegians and percentage of households with 2 or more vehicles available in the United States with a correlation coefficient (R) of 0.735 and weighted average of 62.8%, a difference of 9.9%.
2 or more Vehicles in Household Correlation Summary
| Measurement | Immigrants from Jordan | Norwegian |
| Minimum | 38.9% | 54.4% |
| Maximum | 88.8% | 100.0% |
| Range | 49.9% | 45.6% |
| Mean | 59.5% | 73.2% |
| Median | 59.7% | 69.9% |
| Interquartile 25% (IQ1) | 54.7% | 65.3% |
| Interquartile 75% (IQ3) | 63.6% | 78.0% |
| Interquartile Range (IQR) | 8.9% | 12.7% |
| Standard Deviation (Sample) | 8.6% | 11.3% |
| Standard Deviation (Population) | 8.6% | 11.3% |
Similar Demographics by 2 or more Vehicles in Household
Demographics Similar to Immigrants from Jordan by 2 or more Vehicles in Household
In terms of 2 or more vehicles in household, the demographic groups most similar to Immigrants from Jordan are Chippewa (57.2%, a difference of 0.010%), Immigrants from Lebanon (57.2%, a difference of 0.070%), Zimbabwean (57.2%, a difference of 0.10%), Iraqi (57.1%, a difference of 0.19%), and Asian (57.0%, a difference of 0.36%).
| Demographics | Rating | Rank | 2 or more Vehicles in Household |
| Immigrants | North America | 98.1 /100 | #109 | Exceptional 57.5% |
| Japanese | 98.0 /100 | #110 | Exceptional 57.5% |
| Greeks | 98.0 /100 | #111 | Exceptional 57.5% |
| Pueblo | 98.0 /100 | #112 | Exceptional 57.5% |
| Zimbabweans | 96.9 /100 | #113 | Exceptional 57.2% |
| Immigrants | Lebanon | 96.8 /100 | #114 | Exceptional 57.2% |
| Chippewa | 96.6 /100 | #115 | Exceptional 57.2% |
| Immigrants | Jordan | 96.6 /100 | #116 | Exceptional 57.2% |
| Iraqis | 95.8 /100 | #117 | Exceptional 57.1% |
| Asians | 95.1 /100 | #118 | Exceptional 57.0% |
| Natives/Alaskans | 95.0 /100 | #119 | Exceptional 57.0% |
| Costa Ricans | 94.7 /100 | #120 | Exceptional 56.9% |
| Sioux | 93.8 /100 | #121 | Exceptional 56.8% |
| Immigrants | South Africa | 92.5 /100 | #122 | Exceptional 56.7% |
| Australians | 91.8 /100 | #123 | Exceptional 56.7% |
Demographics Similar to Norwegians by 2 or more Vehicles in Household
In terms of 2 or more vehicles in household, the demographic groups most similar to Norwegians are Danish (63.3%, a difference of 0.69%), Immigrants from Fiji (62.3%, a difference of 0.87%), Tongan (63.5%, a difference of 1.1%), Scandinavian (62.1%, a difference of 1.2%), and Puget Sound Salish (62.1%, a difference of 1.3%).
| Demographics | Rating | Rank | 2 or more Vehicles in Household |
| Yakama | 100.0 /100 | #1 | Exceptional 64.9% |
| Tongans | 100.0 /100 | #2 | Exceptional 63.5% |
| Danes | 100.0 /100 | #3 | Exceptional 63.3% |
| Norwegians | 100.0 /100 | #4 | Exceptional 62.8% |
| Immigrants | Fiji | 100.0 /100 | #5 | Exceptional 62.3% |
| Scandinavians | 100.0 /100 | #6 | Exceptional 62.1% |
| Puget Sound Salish | 100.0 /100 | #7 | Exceptional 62.1% |
| English | 100.0 /100 | #8 | Exceptional 61.9% |
| Swedes | 100.0 /100 | #9 | Exceptional 61.8% |
| Mexicans | 100.0 /100 | #10 | Exceptional 61.7% |
| Dutch | 100.0 /100 | #11 | Exceptional 61.6% |
| Germans | 100.0 /100 | #12 | Exceptional 61.6% |
| Samoans | 100.0 /100 | #13 | Exceptional 61.5% |
| Czechs | 100.0 /100 | #14 | Exceptional 61.5% |
| Nepalese | 100.0 /100 | #15 | Exceptional 61.4% |