Immigrants from Ghana vs Norwegian 2 or more Vehicles in Household
COMPARE
Immigrants from Ghana
Norwegian
2 or more Vehicles in Household
2 or more Vehicles in Household Comparison
Immigrants from Ghana
Norwegians
47.4%
2 OR MORE VEHICLES IN HOUSEHOLD
0.0/ 100
METRIC RATING
314th/ 347
METRIC RANK
62.8%
2 OR MORE VEHICLES IN HOUSEHOLD
100.0/ 100
METRIC RATING
4th/ 347
METRIC RANK
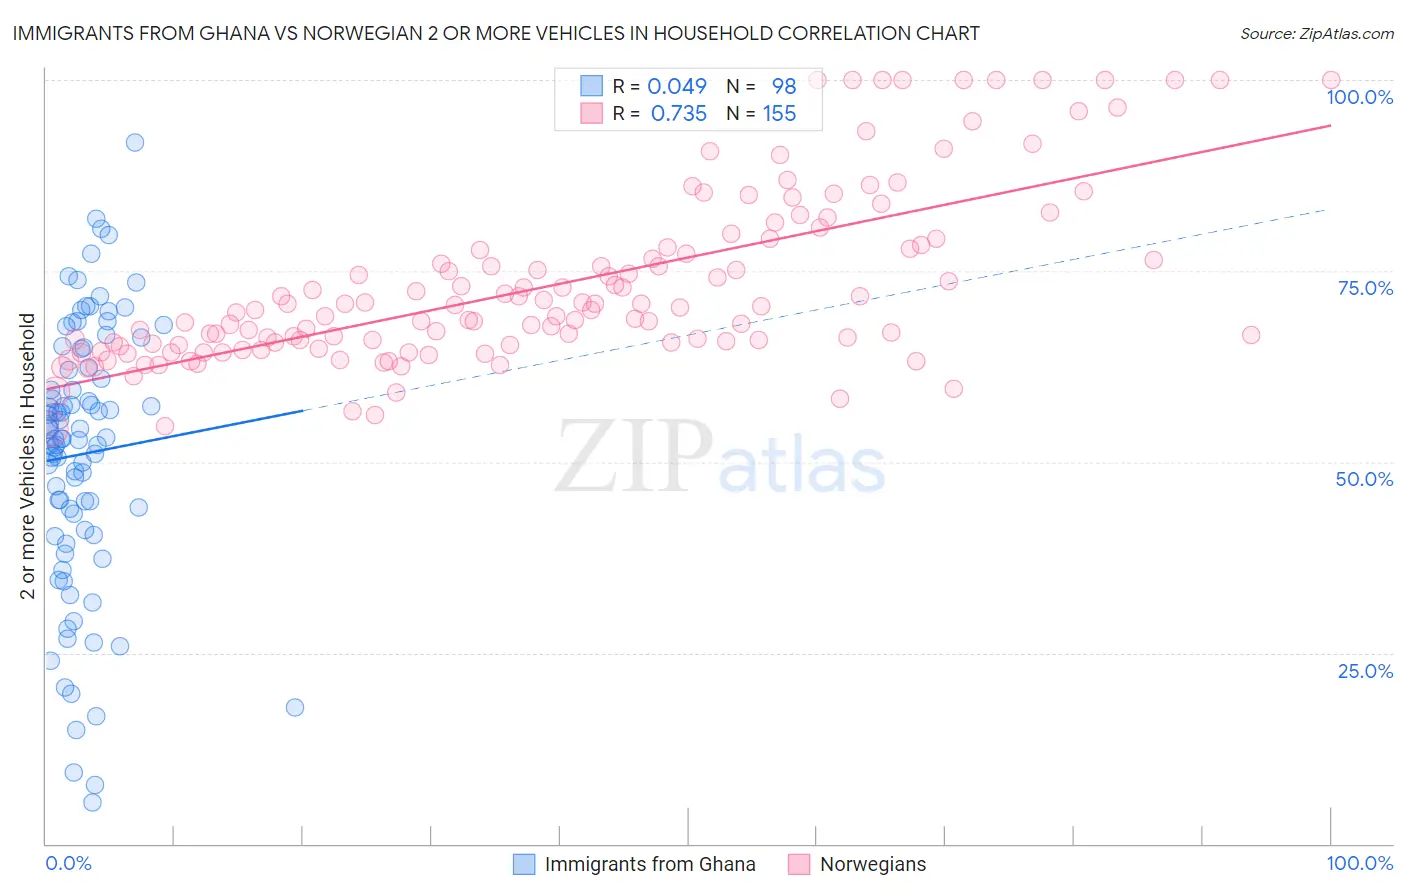
Immigrants from Ghana vs Norwegian 2 or more Vehicles in Household Correlation Chart
The statistical analysis conducted on geographies consisting of 199,813,535 people shows no correlation between the proportion of Immigrants from Ghana and percentage of households with 2 or more vehicles available in the United States with a correlation coefficient (R) of 0.049 and weighted average of 47.4%. Similarly, the statistical analysis conducted on geographies consisting of 532,963,980 people shows a strong positive correlation between the proportion of Norwegians and percentage of households with 2 or more vehicles available in the United States with a correlation coefficient (R) of 0.735 and weighted average of 62.8%, a difference of 32.7%.
2 or more Vehicles in Household Correlation Summary
| Measurement | Immigrants from Ghana | Norwegian |
| Minimum | 5.4% | 54.4% |
| Maximum | 91.9% | 100.0% |
| Range | 86.4% | 45.6% |
| Mean | 51.0% | 73.2% |
| Median | 53.0% | 69.9% |
| Interquartile 25% (IQ1) | 41.0% | 65.3% |
| Interquartile 75% (IQ3) | 62.3% | 78.0% |
| Interquartile Range (IQR) | 21.3% | 12.7% |
| Standard Deviation (Sample) | 17.5% | 11.3% |
| Standard Deviation (Population) | 17.5% | 11.3% |
Similar Demographics by 2 or more Vehicles in Household
Demographics Similar to Immigrants from Ghana by 2 or more Vehicles in Household
In terms of 2 or more vehicles in household, the demographic groups most similar to Immigrants from Ghana are U.S. Virgin Islander (47.5%, a difference of 0.22%), Haitian (47.6%, a difference of 0.40%), Puerto Rican (47.1%, a difference of 0.57%), Immigrants from Belarus (47.9%, a difference of 1.1%), and Ghanaian (48.0%, a difference of 1.3%).
| Demographics | Rating | Rank | 2 or more Vehicles in Household |
| Hopi | 0.0 /100 | #307 | Tragic 49.0% |
| Albanians | 0.0 /100 | #308 | Tragic 49.0% |
| Moroccans | 0.0 /100 | #309 | Tragic 48.8% |
| Ghanaians | 0.0 /100 | #310 | Tragic 48.0% |
| Immigrants | Belarus | 0.0 /100 | #311 | Tragic 47.9% |
| Haitians | 0.0 /100 | #312 | Tragic 47.6% |
| U.S. Virgin Islanders | 0.0 /100 | #313 | Tragic 47.5% |
| Immigrants | Ghana | 0.0 /100 | #314 | Tragic 47.4% |
| Puerto Ricans | 0.0 /100 | #315 | Tragic 47.1% |
| Cape Verdeans | 0.0 /100 | #316 | Tragic 46.8% |
| Immigrants | Haiti | 0.0 /100 | #317 | Tragic 46.5% |
| Immigrants | Albania | 0.0 /100 | #318 | Tragic 46.0% |
| Jamaicans | 0.0 /100 | #319 | Tragic 45.8% |
| Soviet Union | 0.0 /100 | #320 | Tragic 45.7% |
| Immigrants | Jamaica | 0.0 /100 | #321 | Tragic 44.5% |
Demographics Similar to Norwegians by 2 or more Vehicles in Household
In terms of 2 or more vehicles in household, the demographic groups most similar to Norwegians are Danish (63.3%, a difference of 0.69%), Immigrants from Fiji (62.3%, a difference of 0.87%), Tongan (63.5%, a difference of 1.1%), Scandinavian (62.1%, a difference of 1.2%), and Puget Sound Salish (62.1%, a difference of 1.3%).
| Demographics | Rating | Rank | 2 or more Vehicles in Household |
| Yakama | 100.0 /100 | #1 | Exceptional 64.9% |
| Tongans | 100.0 /100 | #2 | Exceptional 63.5% |
| Danes | 100.0 /100 | #3 | Exceptional 63.3% |
| Norwegians | 100.0 /100 | #4 | Exceptional 62.8% |
| Immigrants | Fiji | 100.0 /100 | #5 | Exceptional 62.3% |
| Scandinavians | 100.0 /100 | #6 | Exceptional 62.1% |
| Puget Sound Salish | 100.0 /100 | #7 | Exceptional 62.1% |
| English | 100.0 /100 | #8 | Exceptional 61.9% |
| Swedes | 100.0 /100 | #9 | Exceptional 61.8% |
| Mexicans | 100.0 /100 | #10 | Exceptional 61.7% |
| Dutch | 100.0 /100 | #11 | Exceptional 61.6% |
| Germans | 100.0 /100 | #12 | Exceptional 61.6% |
| Samoans | 100.0 /100 | #13 | Exceptional 61.5% |
| Czechs | 100.0 /100 | #14 | Exceptional 61.5% |
| Nepalese | 100.0 /100 | #15 | Exceptional 61.4% |