Immigrants from South America vs Senegalese 2 or more Vehicles in Household
COMPARE
Immigrants from South America
Senegalese
2 or more Vehicles in Household
2 or more Vehicles in Household Comparison
Immigrants from South America
Senegalese
50.2%
2 OR MORE VEHICLES IN HOUSEHOLD
0.0/ 100
METRIC RATING
302nd/ 347
METRIC RANK
44.2%
2 OR MORE VEHICLES IN HOUSEHOLD
0.0/ 100
METRIC RATING
322nd/ 347
METRIC RANK
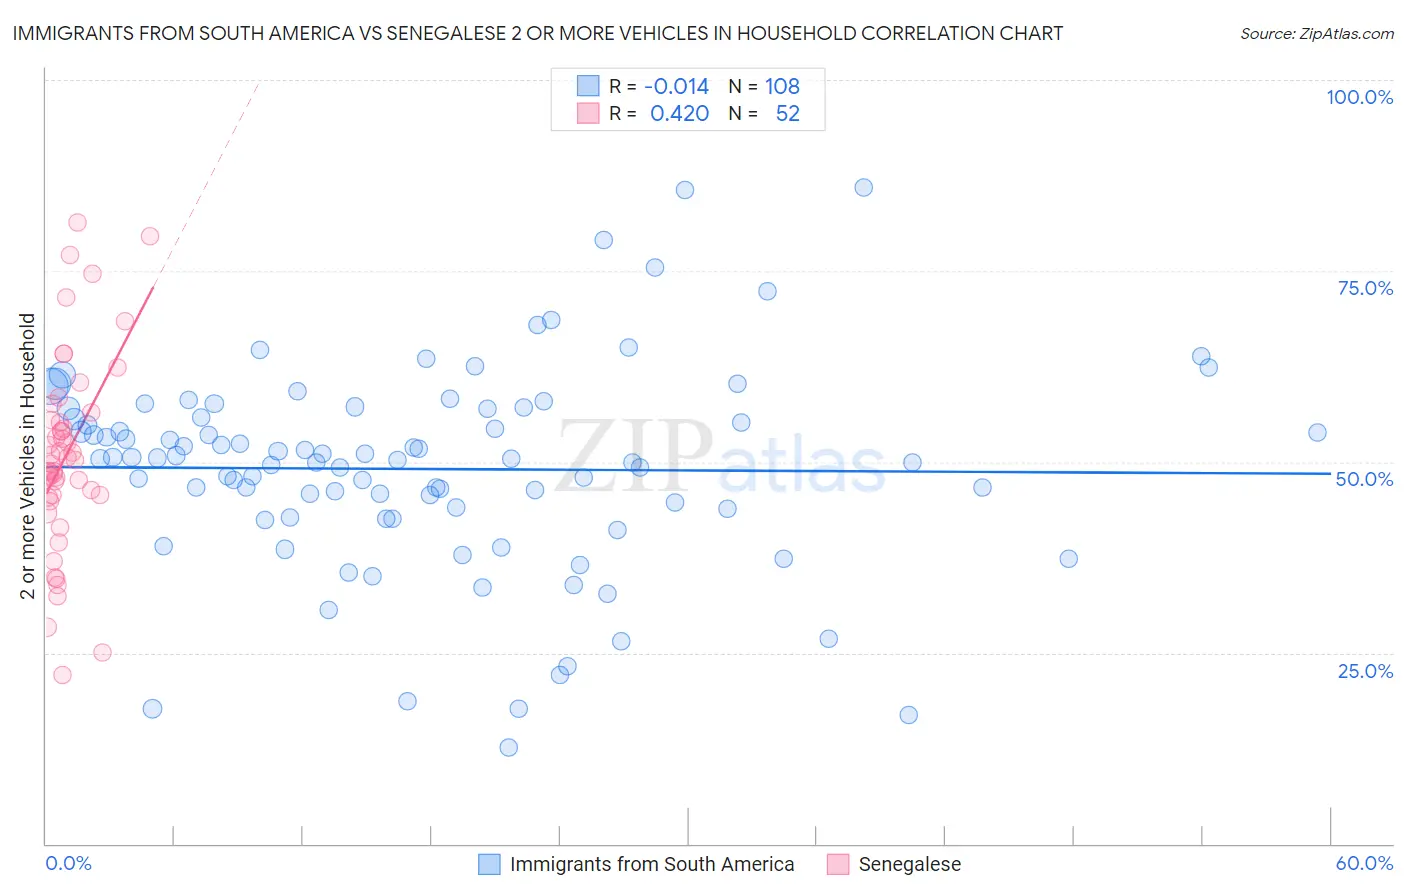
Immigrants from South America vs Senegalese 2 or more Vehicles in Household Correlation Chart
The statistical analysis conducted on geographies consisting of 486,071,920 people shows no correlation between the proportion of Immigrants from South America and percentage of households with 2 or more vehicles available in the United States with a correlation coefficient (R) of -0.014 and weighted average of 50.2%. Similarly, the statistical analysis conducted on geographies consisting of 78,083,411 people shows a moderate positive correlation between the proportion of Senegalese and percentage of households with 2 or more vehicles available in the United States with a correlation coefficient (R) of 0.420 and weighted average of 44.2%, a difference of 13.5%.
2 or more Vehicles in Household Correlation Summary
| Measurement | Immigrants from South America | Senegalese |
| Minimum | 12.6% | 22.1% |
| Maximum | 86.0% | 81.4% |
| Range | 73.3% | 59.3% |
| Mean | 49.1% | 51.0% |
| Median | 50.5% | 50.3% |
| Interquartile 25% (IQ1) | 43.3% | 45.5% |
| Interquartile 75% (IQ3) | 56.5% | 56.0% |
| Interquartile Range (IQR) | 13.2% | 10.5% |
| Standard Deviation (Sample) | 13.3% | 12.8% |
| Standard Deviation (Population) | 13.2% | 12.7% |
Demographics Similar to Immigrants from South America and Senegalese by 2 or more Vehicles in Household
In terms of 2 or more vehicles in household, the demographic groups most similar to Immigrants from South America are Tohono O'odham (50.0%, a difference of 0.37%), Immigrants from Belize (49.9%, a difference of 0.57%), Immigrants from Western Africa (49.4%, a difference of 1.7%), Immigrants from Israel (49.2%, a difference of 1.9%), and Hopi (49.0%, a difference of 2.4%). Similarly, the demographic groups most similar to Senegalese are Immigrants from Jamaica (44.5%, a difference of 0.55%), Soviet Union (45.7%, a difference of 3.4%), Jamaican (45.8%, a difference of 3.5%), Immigrants from Albania (46.0%, a difference of 4.0%), and Immigrants from Haiti (46.5%, a difference of 5.2%).
| Demographics | Rating | Rank | 2 or more Vehicles in Household |
| Immigrants | South America | 0.0 /100 | #302 | Tragic 50.2% |
| Tohono O'odham | 0.0 /100 | #303 | Tragic 50.0% |
| Immigrants | Belize | 0.0 /100 | #304 | Tragic 49.9% |
| Immigrants | Western Africa | 0.0 /100 | #305 | Tragic 49.4% |
| Immigrants | Israel | 0.0 /100 | #306 | Tragic 49.2% |
| Hopi | 0.0 /100 | #307 | Tragic 49.0% |
| Albanians | 0.0 /100 | #308 | Tragic 49.0% |
| Moroccans | 0.0 /100 | #309 | Tragic 48.8% |
| Ghanaians | 0.0 /100 | #310 | Tragic 48.0% |
| Immigrants | Belarus | 0.0 /100 | #311 | Tragic 47.9% |
| Haitians | 0.0 /100 | #312 | Tragic 47.6% |
| U.S. Virgin Islanders | 0.0 /100 | #313 | Tragic 47.5% |
| Immigrants | Ghana | 0.0 /100 | #314 | Tragic 47.4% |
| Puerto Ricans | 0.0 /100 | #315 | Tragic 47.1% |
| Cape Verdeans | 0.0 /100 | #316 | Tragic 46.8% |
| Immigrants | Haiti | 0.0 /100 | #317 | Tragic 46.5% |
| Immigrants | Albania | 0.0 /100 | #318 | Tragic 46.0% |
| Jamaicans | 0.0 /100 | #319 | Tragic 45.8% |
| Soviet Union | 0.0 /100 | #320 | Tragic 45.7% |
| Immigrants | Jamaica | 0.0 /100 | #321 | Tragic 44.5% |
| Senegalese | 0.0 /100 | #322 | Tragic 44.2% |