Immigrants from Dominica vs Norwegian 2 or more Vehicles in Household
COMPARE
Immigrants from Dominica
Norwegian
2 or more Vehicles in Household
2 or more Vehicles in Household Comparison
Immigrants from Dominica
Norwegians
41.6%
2 OR MORE VEHICLES IN HOUSEHOLD
0.0/ 100
METRIC RATING
330th/ 347
METRIC RANK
62.8%
2 OR MORE VEHICLES IN HOUSEHOLD
100.0/ 100
METRIC RATING
4th/ 347
METRIC RANK
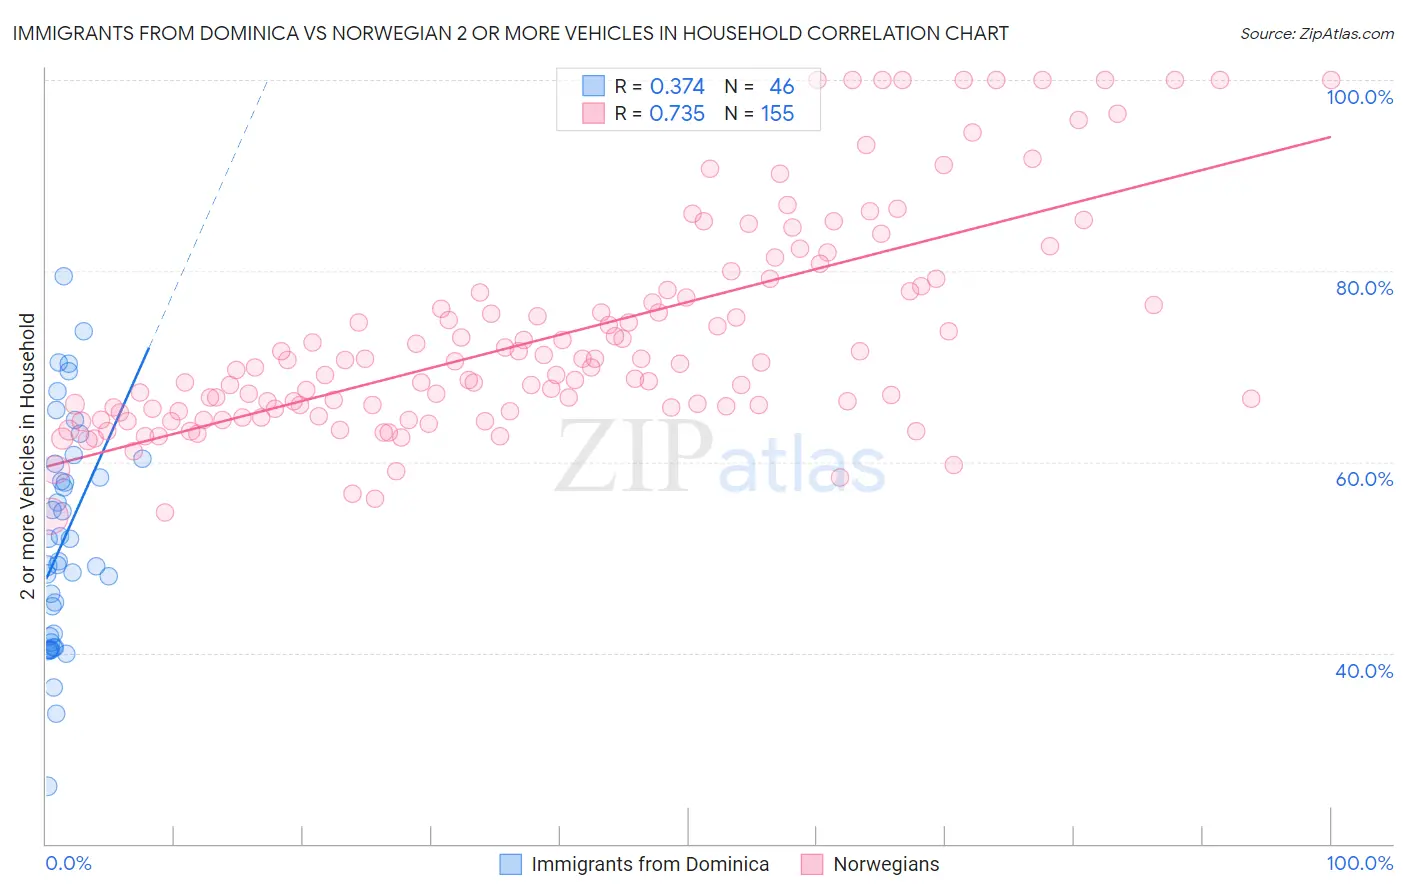
Immigrants from Dominica vs Norwegian 2 or more Vehicles in Household Correlation Chart
The statistical analysis conducted on geographies consisting of 83,789,752 people shows a mild positive correlation between the proportion of Immigrants from Dominica and percentage of households with 2 or more vehicles available in the United States with a correlation coefficient (R) of 0.374 and weighted average of 41.6%. Similarly, the statistical analysis conducted on geographies consisting of 532,963,980 people shows a strong positive correlation between the proportion of Norwegians and percentage of households with 2 or more vehicles available in the United States with a correlation coefficient (R) of 0.735 and weighted average of 62.8%, a difference of 50.9%.
2 or more Vehicles in Household Correlation Summary
| Measurement | Immigrants from Dominica | Norwegian |
| Minimum | 26.1% | 54.4% |
| Maximum | 79.4% | 100.0% |
| Range | 53.3% | 45.6% |
| Mean | 51.7% | 73.2% |
| Median | 49.4% | 69.9% |
| Interquartile 25% (IQ1) | 41.1% | 65.3% |
| Interquartile 75% (IQ3) | 59.8% | 78.0% |
| Interquartile Range (IQR) | 18.8% | 12.7% |
| Standard Deviation (Sample) | 11.7% | 11.3% |
| Standard Deviation (Population) | 11.5% | 11.3% |
Similar Demographics by 2 or more Vehicles in Household
Demographics Similar to Immigrants from Dominica by 2 or more Vehicles in Household
In terms of 2 or more vehicles in household, the demographic groups most similar to Immigrants from Dominica are Ecuadorian (42.0%, a difference of 0.82%), West Indian (41.3%, a difference of 0.85%), Trinidadian and Tobagonian (40.9%, a difference of 1.8%), Inupiat (42.6%, a difference of 2.4%), and Immigrants from Ecuador (40.5%, a difference of 2.8%).
| Demographics | Rating | Rank | 2 or more Vehicles in Household |
| Immigrants | Caribbean | 0.0 /100 | #323 | Tragic 44.2% |
| Immigrants | Cabo Verde | 0.0 /100 | #324 | Tragic 43.3% |
| Immigrants | West Indies | 0.0 /100 | #325 | Tragic 43.1% |
| Immigrants | Senegal | 0.0 /100 | #326 | Tragic 43.0% |
| Immigrants | Yemen | 0.0 /100 | #327 | Tragic 42.8% |
| Inupiat | 0.0 /100 | #328 | Tragic 42.6% |
| Ecuadorians | 0.0 /100 | #329 | Tragic 42.0% |
| Immigrants | Dominica | 0.0 /100 | #330 | Tragic 41.6% |
| West Indians | 0.0 /100 | #331 | Tragic 41.3% |
| Trinidadians and Tobagonians | 0.0 /100 | #332 | Tragic 40.9% |
| Immigrants | Ecuador | 0.0 /100 | #333 | Tragic 40.5% |
| Immigrants | Trinidad and Tobago | 0.0 /100 | #334 | Tragic 40.3% |
| Immigrants | Bangladesh | 0.0 /100 | #335 | Tragic 38.8% |
| Vietnamese | 0.0 /100 | #336 | Tragic 38.5% |
| Barbadians | 0.0 /100 | #337 | Tragic 38.3% |
Demographics Similar to Norwegians by 2 or more Vehicles in Household
In terms of 2 or more vehicles in household, the demographic groups most similar to Norwegians are Danish (63.3%, a difference of 0.69%), Immigrants from Fiji (62.3%, a difference of 0.87%), Tongan (63.5%, a difference of 1.1%), Scandinavian (62.1%, a difference of 1.2%), and Puget Sound Salish (62.1%, a difference of 1.3%).
| Demographics | Rating | Rank | 2 or more Vehicles in Household |
| Yakama | 100.0 /100 | #1 | Exceptional 64.9% |
| Tongans | 100.0 /100 | #2 | Exceptional 63.5% |
| Danes | 100.0 /100 | #3 | Exceptional 63.3% |
| Norwegians | 100.0 /100 | #4 | Exceptional 62.8% |
| Immigrants | Fiji | 100.0 /100 | #5 | Exceptional 62.3% |
| Scandinavians | 100.0 /100 | #6 | Exceptional 62.1% |
| Puget Sound Salish | 100.0 /100 | #7 | Exceptional 62.1% |
| English | 100.0 /100 | #8 | Exceptional 61.9% |
| Swedes | 100.0 /100 | #9 | Exceptional 61.8% |
| Mexicans | 100.0 /100 | #10 | Exceptional 61.7% |
| Dutch | 100.0 /100 | #11 | Exceptional 61.6% |
| Germans | 100.0 /100 | #12 | Exceptional 61.6% |
| Samoans | 100.0 /100 | #13 | Exceptional 61.5% |
| Czechs | 100.0 /100 | #14 | Exceptional 61.5% |
| Nepalese | 100.0 /100 | #15 | Exceptional 61.4% |