Immigrants from South America vs Belizean 2 or more Vehicles in Household
COMPARE
Immigrants from South America
Belizean
2 or more Vehicles in Household
2 or more Vehicles in Household Comparison
Immigrants from South America
Belizeans
50.2%
2 OR MORE VEHICLES IN HOUSEHOLD
0.0/ 100
METRIC RATING
302nd/ 347
METRIC RANK
51.0%
2 OR MORE VEHICLES IN HOUSEHOLD
0.0/ 100
METRIC RATING
291st/ 347
METRIC RANK
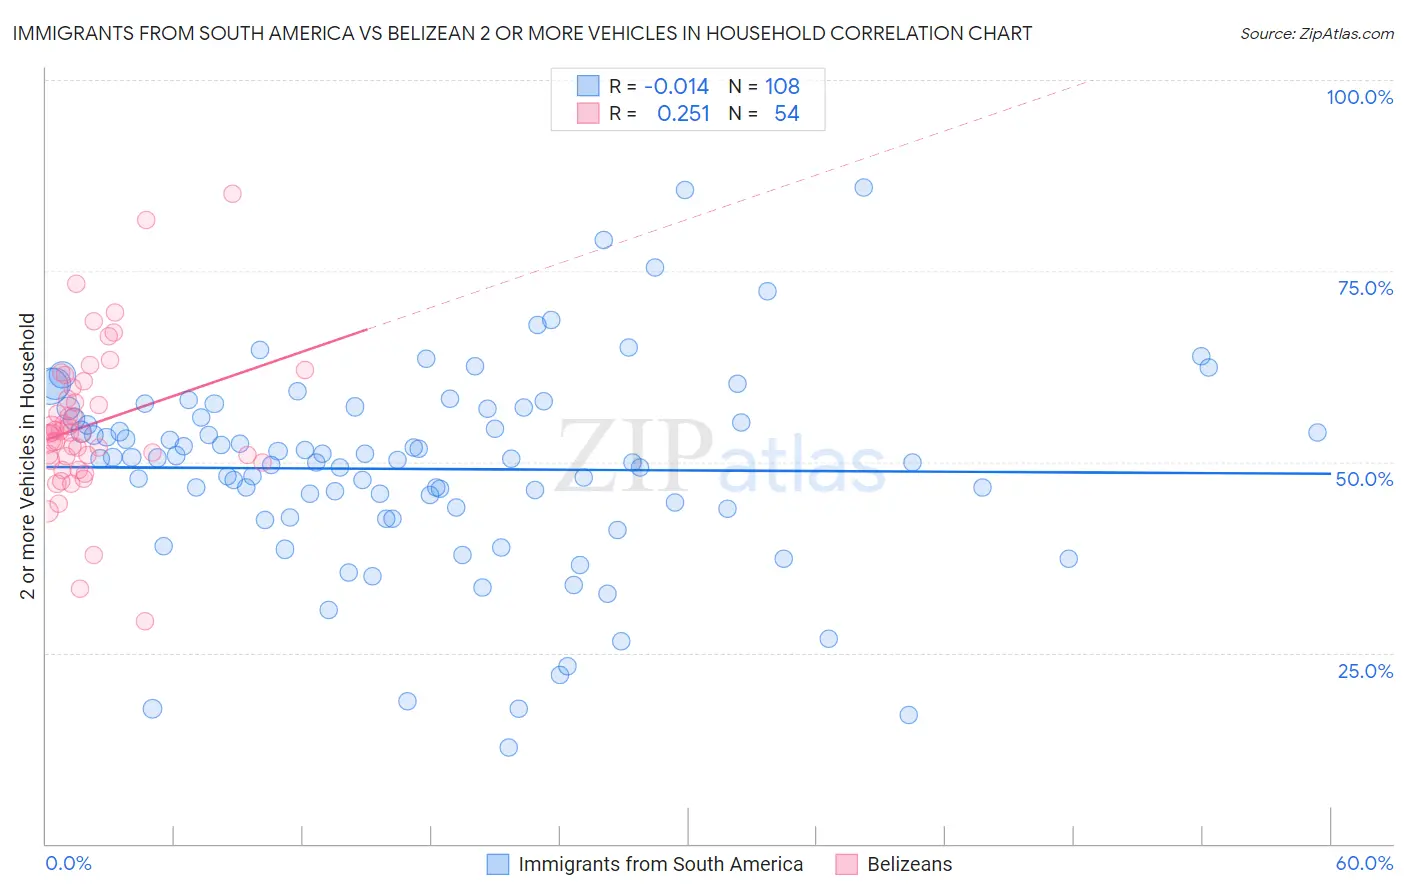
Immigrants from South America vs Belizean 2 or more Vehicles in Household Correlation Chart
The statistical analysis conducted on geographies consisting of 486,071,920 people shows no correlation between the proportion of Immigrants from South America and percentage of households with 2 or more vehicles available in the United States with a correlation coefficient (R) of -0.014 and weighted average of 50.2%. Similarly, the statistical analysis conducted on geographies consisting of 144,162,212 people shows a weak positive correlation between the proportion of Belizeans and percentage of households with 2 or more vehicles available in the United States with a correlation coefficient (R) of 0.251 and weighted average of 51.0%, a difference of 1.7%.
2 or more Vehicles in Household Correlation Summary
| Measurement | Immigrants from South America | Belizean |
| Minimum | 12.6% | 29.2% |
| Maximum | 86.0% | 85.1% |
| Range | 73.3% | 55.9% |
| Mean | 49.1% | 54.9% |
| Median | 50.5% | 53.8% |
| Interquartile 25% (IQ1) | 43.3% | 50.2% |
| Interquartile 75% (IQ3) | 56.5% | 59.7% |
| Interquartile Range (IQR) | 13.2% | 9.5% |
| Standard Deviation (Sample) | 13.3% | 9.9% |
| Standard Deviation (Population) | 13.2% | 9.8% |
Demographics Similar to Immigrants from South America and Belizeans by 2 or more Vehicles in Household
In terms of 2 or more vehicles in household, the demographic groups most similar to Immigrants from South America are Immigrants from Greece (50.2%, a difference of 0.060%), Immigrants from Russia (50.3%, a difference of 0.24%), Immigrants from Morocco (50.3%, a difference of 0.28%), Paraguayan (50.3%, a difference of 0.31%), and Tohono O'odham (50.0%, a difference of 0.37%). Similarly, the demographic groups most similar to Belizeans are Immigrants from Panama (51.1%, a difference of 0.030%), Somali (51.1%, a difference of 0.10%), Immigrants from Ukraine (50.9%, a difference of 0.33%), Black/African American (50.9%, a difference of 0.33%), and Okinawan (51.2%, a difference of 0.38%).
| Demographics | Rating | Rank | 2 or more Vehicles in Household |
| Immigrants | Liberia | 0.1 /100 | #286 | Tragic 51.3% |
| Immigrants | Serbia | 0.1 /100 | #287 | Tragic 51.3% |
| Okinawans | 0.1 /100 | #288 | Tragic 51.2% |
| Somalis | 0.0 /100 | #289 | Tragic 51.1% |
| Immigrants | Panama | 0.0 /100 | #290 | Tragic 51.1% |
| Belizeans | 0.0 /100 | #291 | Tragic 51.0% |
| Immigrants | Ukraine | 0.0 /100 | #292 | Tragic 50.9% |
| Blacks/African Americans | 0.0 /100 | #293 | Tragic 50.9% |
| Bermudans | 0.0 /100 | #294 | Tragic 50.6% |
| Cypriots | 0.0 /100 | #295 | Tragic 50.6% |
| Immigrants | Somalia | 0.0 /100 | #296 | Tragic 50.5% |
| Immigrants | Spain | 0.0 /100 | #297 | Tragic 50.4% |
| Paraguayans | 0.0 /100 | #298 | Tragic 50.3% |
| Immigrants | Morocco | 0.0 /100 | #299 | Tragic 50.3% |
| Immigrants | Russia | 0.0 /100 | #300 | Tragic 50.3% |
| Immigrants | Greece | 0.0 /100 | #301 | Tragic 50.2% |
| Immigrants | South America | 0.0 /100 | #302 | Tragic 50.2% |
| Tohono O'odham | 0.0 /100 | #303 | Tragic 50.0% |
| Immigrants | Belize | 0.0 /100 | #304 | Tragic 49.9% |
| Immigrants | Western Africa | 0.0 /100 | #305 | Tragic 49.4% |
| Immigrants | Israel | 0.0 /100 | #306 | Tragic 49.2% |