Immigrants from Somalia vs Immigrants from Eritrea 2 or more Vehicles in Household
COMPARE
Immigrants from Somalia
Immigrants from Eritrea
2 or more Vehicles in Household
2 or more Vehicles in Household Comparison
Immigrants from Somalia
Immigrants from Eritrea
50.5%
2 OR MORE VEHICLES IN HOUSEHOLD
0.0/ 100
METRIC RATING
296th/ 347
METRIC RANK
52.6%
2 OR MORE VEHICLES IN HOUSEHOLD
0.7/ 100
METRIC RATING
256th/ 347
METRIC RANK
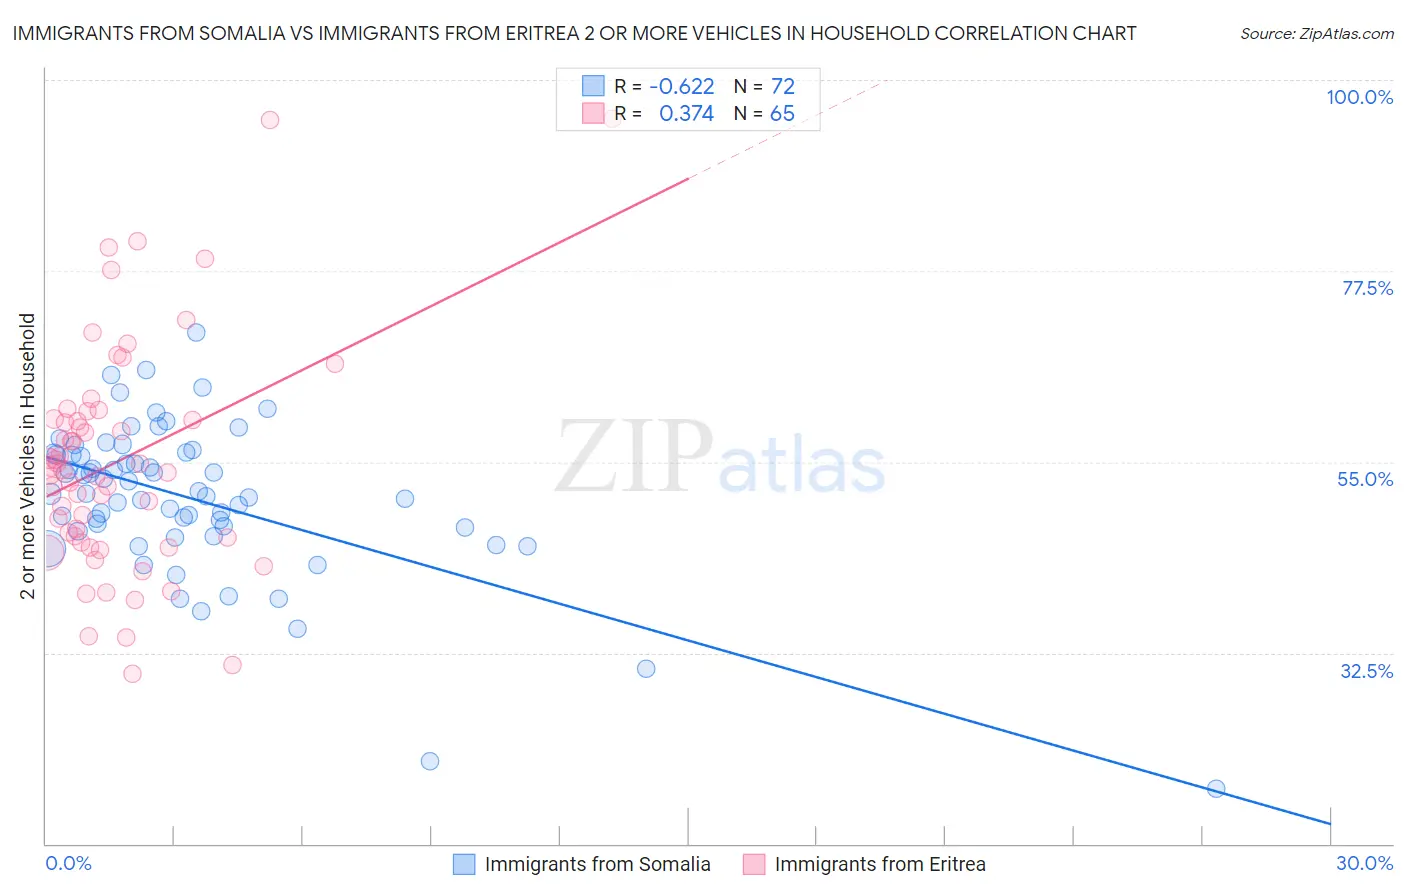
Immigrants from Somalia vs Immigrants from Eritrea 2 or more Vehicles in Household Correlation Chart
The statistical analysis conducted on geographies consisting of 92,099,501 people shows a significant negative correlation between the proportion of Immigrants from Somalia and percentage of households with 2 or more vehicles available in the United States with a correlation coefficient (R) of -0.622 and weighted average of 50.5%. Similarly, the statistical analysis conducted on geographies consisting of 104,847,164 people shows a mild positive correlation between the proportion of Immigrants from Eritrea and percentage of households with 2 or more vehicles available in the United States with a correlation coefficient (R) of 0.374 and weighted average of 52.6%, a difference of 4.1%.
2 or more Vehicles in Household Correlation Summary
| Measurement | Immigrants from Somalia | Immigrants from Eritrea |
| Minimum | 16.4% | 30.0% |
| Maximum | 70.3% | 95.5% |
| Range | 53.8% | 65.4% |
| Mean | 50.6% | 55.1% |
| Median | 51.2% | 54.0% |
| Interquartile 25% (IQ1) | 47.1% | 45.8% |
| Interquartile 75% (IQ3) | 55.9% | 60.5% |
| Interquartile Range (IQR) | 8.8% | 14.7% |
| Standard Deviation (Sample) | 9.2% | 13.5% |
| Standard Deviation (Population) | 9.1% | 13.4% |
Similar Demographics by 2 or more Vehicles in Household
Demographics Similar to Immigrants from Somalia by 2 or more Vehicles in Household
In terms of 2 or more vehicles in household, the demographic groups most similar to Immigrants from Somalia are Cypriot (50.6%, a difference of 0.040%), Bermudan (50.6%, a difference of 0.11%), Immigrants from Spain (50.4%, a difference of 0.27%), Paraguayan (50.3%, a difference of 0.40%), and Immigrants from Morocco (50.3%, a difference of 0.43%).
| Demographics | Rating | Rank | 2 or more Vehicles in Household |
| Somalis | 0.0 /100 | #289 | Tragic 51.1% |
| Immigrants | Panama | 0.0 /100 | #290 | Tragic 51.1% |
| Belizeans | 0.0 /100 | #291 | Tragic 51.0% |
| Immigrants | Ukraine | 0.0 /100 | #292 | Tragic 50.9% |
| Blacks/African Americans | 0.0 /100 | #293 | Tragic 50.9% |
| Bermudans | 0.0 /100 | #294 | Tragic 50.6% |
| Cypriots | 0.0 /100 | #295 | Tragic 50.6% |
| Immigrants | Somalia | 0.0 /100 | #296 | Tragic 50.5% |
| Immigrants | Spain | 0.0 /100 | #297 | Tragic 50.4% |
| Paraguayans | 0.0 /100 | #298 | Tragic 50.3% |
| Immigrants | Morocco | 0.0 /100 | #299 | Tragic 50.3% |
| Immigrants | Russia | 0.0 /100 | #300 | Tragic 50.3% |
| Immigrants | Greece | 0.0 /100 | #301 | Tragic 50.2% |
| Immigrants | South America | 0.0 /100 | #302 | Tragic 50.2% |
| Tohono O'odham | 0.0 /100 | #303 | Tragic 50.0% |
Demographics Similar to Immigrants from Eritrea by 2 or more Vehicles in Household
In terms of 2 or more vehicles in household, the demographic groups most similar to Immigrants from Eritrea are Uruguayan (52.7%, a difference of 0.040%), Immigrants from Malaysia (52.7%, a difference of 0.070%), Immigrants from Hong Kong (52.6%, a difference of 0.14%), Central American Indian (52.5%, a difference of 0.24%), and Nigerian (52.8%, a difference of 0.26%).
| Demographics | Rating | Rank | 2 or more Vehicles in Household |
| Immigrants | Brazil | 1.0 /100 | #249 | Tragic 52.8% |
| Mongolians | 1.0 /100 | #250 | Tragic 52.8% |
| Immigrants | Sudan | 1.0 /100 | #251 | Tragic 52.8% |
| Immigrants | Portugal | 1.0 /100 | #252 | Tragic 52.8% |
| Nigerians | 0.9 /100 | #253 | Tragic 52.8% |
| Immigrants | Malaysia | 0.8 /100 | #254 | Tragic 52.7% |
| Uruguayans | 0.7 /100 | #255 | Tragic 52.7% |
| Immigrants | Eritrea | 0.7 /100 | #256 | Tragic 52.6% |
| Immigrants | Hong Kong | 0.6 /100 | #257 | Tragic 52.6% |
| Central American Indians | 0.6 /100 | #258 | Tragic 52.5% |
| Alsatians | 0.6 /100 | #259 | Tragic 52.5% |
| Immigrants | Bahamas | 0.5 /100 | #260 | Tragic 52.5% |
| Immigrants | Australia | 0.5 /100 | #261 | Tragic 52.4% |
| Immigrants | Northern Africa | 0.4 /100 | #262 | Tragic 52.3% |
| Immigrants | Southern Europe | 0.4 /100 | #263 | Tragic 52.3% |