Immigrants from Malaysia vs Crow 2 or more Vehicles in Household
COMPARE
Immigrants from Malaysia
Crow
2 or more Vehicles in Household
2 or more Vehicles in Household Comparison
Immigrants from Malaysia
Crow
52.7%
2 OR MORE VEHICLES IN HOUSEHOLD
0.8/ 100
METRIC RATING
254th/ 347
METRIC RANK
55.7%
2 OR MORE VEHICLES IN HOUSEHOLD
67.0/ 100
METRIC RATING
160th/ 347
METRIC RANK
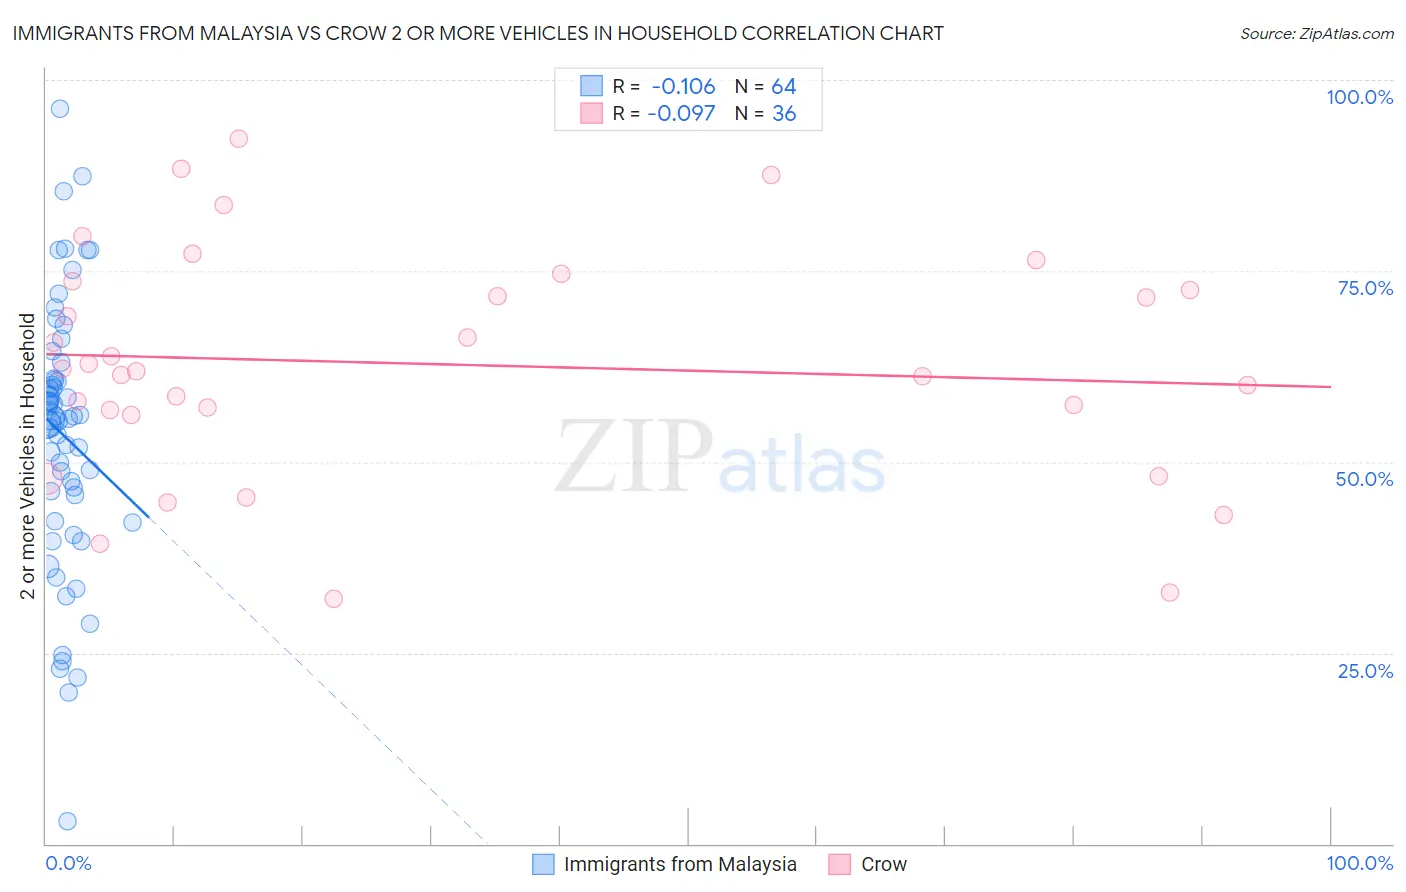
Immigrants from Malaysia vs Crow 2 or more Vehicles in Household Correlation Chart
The statistical analysis conducted on geographies consisting of 197,930,354 people shows a poor negative correlation between the proportion of Immigrants from Malaysia and percentage of households with 2 or more vehicles available in the United States with a correlation coefficient (R) of -0.106 and weighted average of 52.7%. Similarly, the statistical analysis conducted on geographies consisting of 59,203,156 people shows a slight negative correlation between the proportion of Crow and percentage of households with 2 or more vehicles available in the United States with a correlation coefficient (R) of -0.097 and weighted average of 55.7%, a difference of 5.8%.
2 or more Vehicles in Household Correlation Summary
| Measurement | Immigrants from Malaysia | Crow |
| Minimum | 2.9% | 32.0% |
| Maximum | 96.2% | 92.3% |
| Range | 93.3% | 60.3% |
| Mean | 53.5% | 62.8% |
| Median | 55.5% | 62.0% |
| Interquartile 25% (IQ1) | 43.9% | 56.5% |
| Interquartile 75% (IQ3) | 60.8% | 73.1% |
| Interquartile Range (IQR) | 16.9% | 16.6% |
| Standard Deviation (Sample) | 17.5% | 15.0% |
| Standard Deviation (Population) | 17.3% | 14.8% |
Similar Demographics by 2 or more Vehicles in Household
Demographics Similar to Immigrants from Malaysia by 2 or more Vehicles in Household
In terms of 2 or more vehicles in household, the demographic groups most similar to Immigrants from Malaysia are Uruguayan (52.7%, a difference of 0.030%), Immigrants from Eritrea (52.6%, a difference of 0.070%), Nigerian (52.8%, a difference of 0.19%), Immigrants from Hong Kong (52.6%, a difference of 0.21%), and Immigrants from Portugal (52.8%, a difference of 0.24%).
| Demographics | Rating | Rank | 2 or more Vehicles in Household |
| Sierra Leoneans | 1.2 /100 | #247 | Tragic 52.9% |
| Colombians | 1.1 /100 | #248 | Tragic 52.9% |
| Immigrants | Brazil | 1.0 /100 | #249 | Tragic 52.8% |
| Mongolians | 1.0 /100 | #250 | Tragic 52.8% |
| Immigrants | Sudan | 1.0 /100 | #251 | Tragic 52.8% |
| Immigrants | Portugal | 1.0 /100 | #252 | Tragic 52.8% |
| Nigerians | 0.9 /100 | #253 | Tragic 52.8% |
| Immigrants | Malaysia | 0.8 /100 | #254 | Tragic 52.7% |
| Uruguayans | 0.7 /100 | #255 | Tragic 52.7% |
| Immigrants | Eritrea | 0.7 /100 | #256 | Tragic 52.6% |
| Immigrants | Hong Kong | 0.6 /100 | #257 | Tragic 52.6% |
| Central American Indians | 0.6 /100 | #258 | Tragic 52.5% |
| Alsatians | 0.6 /100 | #259 | Tragic 52.5% |
| Immigrants | Bahamas | 0.5 /100 | #260 | Tragic 52.5% |
| Immigrants | Australia | 0.5 /100 | #261 | Tragic 52.4% |
Demographics Similar to Crow by 2 or more Vehicles in Household
In terms of 2 or more vehicles in household, the demographic groups most similar to Crow are Paiute (55.8%, a difference of 0.050%), Tlingit-Haida (55.8%, a difference of 0.070%), Immigrants from Kuwait (55.8%, a difference of 0.14%), Immigrants from Lithuania (55.8%, a difference of 0.15%), and Ukrainian (55.8%, a difference of 0.17%).
| Demographics | Rating | Rank | 2 or more Vehicles in Household |
| Lumbee | 71.9 /100 | #153 | Good 55.9% |
| Ukrainians | 70.8 /100 | #154 | Good 55.8% |
| Immigrants | Venezuela | 70.7 /100 | #155 | Good 55.8% |
| Immigrants | Lithuania | 70.4 /100 | #156 | Good 55.8% |
| Immigrants | Kuwait | 70.2 /100 | #157 | Good 55.8% |
| Tlingit-Haida | 68.5 /100 | #158 | Good 55.8% |
| Paiute | 68.0 /100 | #159 | Good 55.8% |
| Crow | 67.0 /100 | #160 | Good 55.7% |
| Colville | 61.1 /100 | #161 | Good 55.6% |
| German Russians | 60.9 /100 | #162 | Good 55.6% |
| Immigrants | Zimbabwe | 60.2 /100 | #163 | Good 55.6% |
| Dutch West Indians | 59.8 /100 | #164 | Average 55.6% |
| Immigrants | El Salvador | 59.4 /100 | #165 | Average 55.6% |
| Immigrants | Sri Lanka | 58.3 /100 | #166 | Average 55.5% |
| Kenyans | 58.1 /100 | #167 | Average 55.5% |