Immigrants from France vs Immigrants from Zimbabwe 3 or more Vehicles in Household
COMPARE
Immigrants from France
Immigrants from Zimbabwe
3 or more Vehicles in Household
3 or more Vehicles in Household Comparison
Immigrants from France
Immigrants from Zimbabwe
17.6%
3 OR MORE VEHICLES IN HOUSEHOLD
0.6/ 100
METRIC RATING
269th/ 347
METRIC RANK
19.1%
3 OR MORE VEHICLES IN HOUSEHOLD
25.5/ 100
METRIC RATING
190th/ 347
METRIC RANK
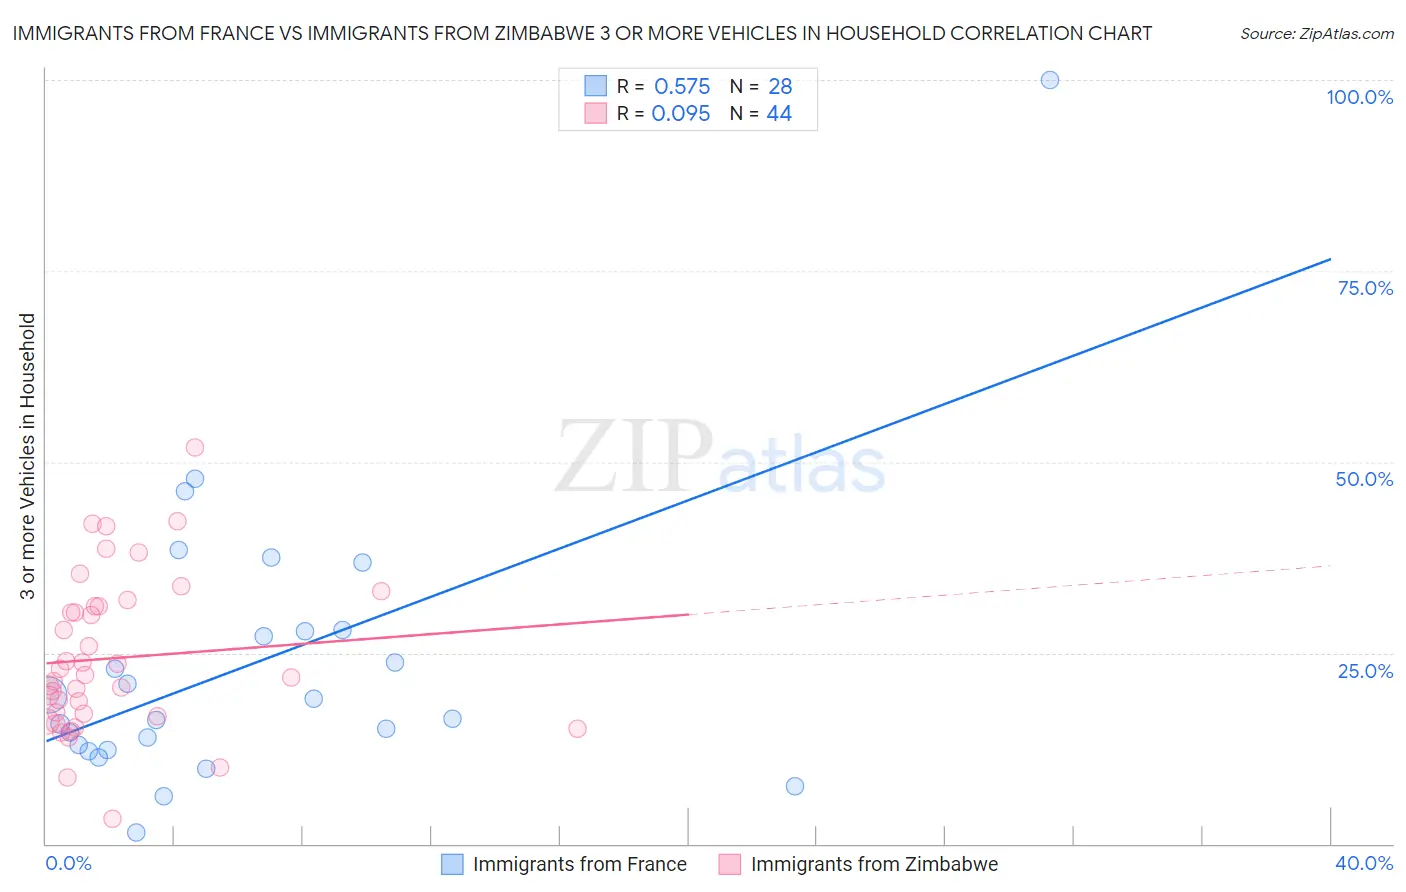
Immigrants from France vs Immigrants from Zimbabwe 3 or more Vehicles in Household Correlation Chart
The statistical analysis conducted on geographies consisting of 287,763,737 people shows a substantial positive correlation between the proportion of Immigrants from France and percentage of households with 3 or more vehicles available in the United States with a correlation coefficient (R) of 0.575 and weighted average of 17.6%. Similarly, the statistical analysis conducted on geographies consisting of 117,785,307 people shows a slight positive correlation between the proportion of Immigrants from Zimbabwe and percentage of households with 3 or more vehicles available in the United States with a correlation coefficient (R) of 0.095 and weighted average of 19.1%, a difference of 8.3%.
3 or more Vehicles in Household Correlation Summary
| Measurement | Immigrants from France | Immigrants from Zimbabwe |
| Minimum | 1.5% | 3.3% |
| Maximum | 100.0% | 51.9% |
| Range | 98.5% | 48.5% |
| Mean | 23.6% | 24.3% |
| Median | 17.7% | 21.9% |
| Interquartile 25% (IQ1) | 12.6% | 16.8% |
| Interquartile 75% (IQ3) | 27.9% | 31.1% |
| Interquartile Range (IQR) | 15.4% | 14.3% |
| Standard Deviation (Sample) | 19.1% | 10.2% |
| Standard Deviation (Population) | 18.7% | 10.1% |
Similar Demographics by 3 or more Vehicles in Household
Demographics Similar to Immigrants from France by 3 or more Vehicles in Household
In terms of 3 or more vehicles in household, the demographic groups most similar to Immigrants from France are Immigrants from Nepal (17.6%, a difference of 0.050%), South American (17.6%, a difference of 0.050%), Immigrants from Bulgaria (17.7%, a difference of 0.42%), Immigrants from Venezuela (17.7%, a difference of 0.44%), and Immigrants from Africa (17.6%, a difference of 0.46%).
| Demographics | Rating | Rank | 3 or more Vehicles in Household |
| Colombians | 0.9 /100 | #262 | Tragic 17.8% |
| Bermudans | 0.9 /100 | #263 | Tragic 17.8% |
| Cambodians | 0.9 /100 | #264 | Tragic 17.8% |
| Immigrants | Panama | 0.8 /100 | #265 | Tragic 17.7% |
| Macedonians | 0.8 /100 | #266 | Tragic 17.7% |
| Immigrants | Venezuela | 0.8 /100 | #267 | Tragic 17.7% |
| Immigrants | Bulgaria | 0.8 /100 | #268 | Tragic 17.7% |
| Immigrants | France | 0.6 /100 | #269 | Tragic 17.6% |
| Immigrants | Nepal | 0.6 /100 | #270 | Tragic 17.6% |
| South Americans | 0.6 /100 | #271 | Tragic 17.6% |
| Immigrants | Africa | 0.5 /100 | #272 | Tragic 17.6% |
| Immigrants | Sudan | 0.5 /100 | #273 | Tragic 17.6% |
| Immigrants | Bosnia and Herzegovina | 0.5 /100 | #274 | Tragic 17.5% |
| Immigrants | Ukraine | 0.4 /100 | #275 | Tragic 17.5% |
| Okinawans | 0.4 /100 | #276 | Tragic 17.4% |
Demographics Similar to Immigrants from Zimbabwe by 3 or more Vehicles in Household
In terms of 3 or more vehicles in household, the demographic groups most similar to Immigrants from Zimbabwe are South American Indian (19.1%, a difference of 0.010%), Indian (Asian) (19.1%, a difference of 0.050%), Immigrants from Kuwait (19.1%, a difference of 0.060%), Kenyan (19.1%, a difference of 0.080%), and Tsimshian (19.1%, a difference of 0.11%).
| Demographics | Rating | Rank | 3 or more Vehicles in Household |
| Cajuns | 36.0 /100 | #183 | Fair 19.3% |
| Latvians | 35.7 /100 | #184 | Fair 19.3% |
| Immigrants | Sri Lanka | 30.7 /100 | #185 | Fair 19.2% |
| Immigrants | Sweden | 29.0 /100 | #186 | Fair 19.2% |
| Immigrants | Hong Kong | 28.3 /100 | #187 | Fair 19.2% |
| Immigrants | Kuwait | 26.1 /100 | #188 | Fair 19.1% |
| Indians (Asian) | 26.0 /100 | #189 | Fair 19.1% |
| Immigrants | Zimbabwe | 25.5 /100 | #190 | Fair 19.1% |
| South American Indians | 25.4 /100 | #191 | Fair 19.1% |
| Kenyans | 24.7 /100 | #192 | Fair 19.1% |
| Tsimshian | 24.4 /100 | #193 | Fair 19.1% |
| Serbians | 24.0 /100 | #194 | Fair 19.1% |
| Immigrants | Moldova | 23.6 /100 | #195 | Fair 19.1% |
| Central American Indians | 22.2 /100 | #196 | Fair 19.0% |
| Immigrants | Japan | 22.0 /100 | #197 | Fair 19.0% |