Iraqi vs Immigrants from Zimbabwe 3 or more Vehicles in Household
COMPARE
Iraqi
Immigrants from Zimbabwe
3 or more Vehicles in Household
3 or more Vehicles in Household Comparison
Iraqis
Immigrants from Zimbabwe
19.6%
3 OR MORE VEHICLES IN HOUSEHOLD
56.0/ 100
METRIC RATING
170th/ 347
METRIC RANK
19.1%
3 OR MORE VEHICLES IN HOUSEHOLD
25.5/ 100
METRIC RATING
190th/ 347
METRIC RANK
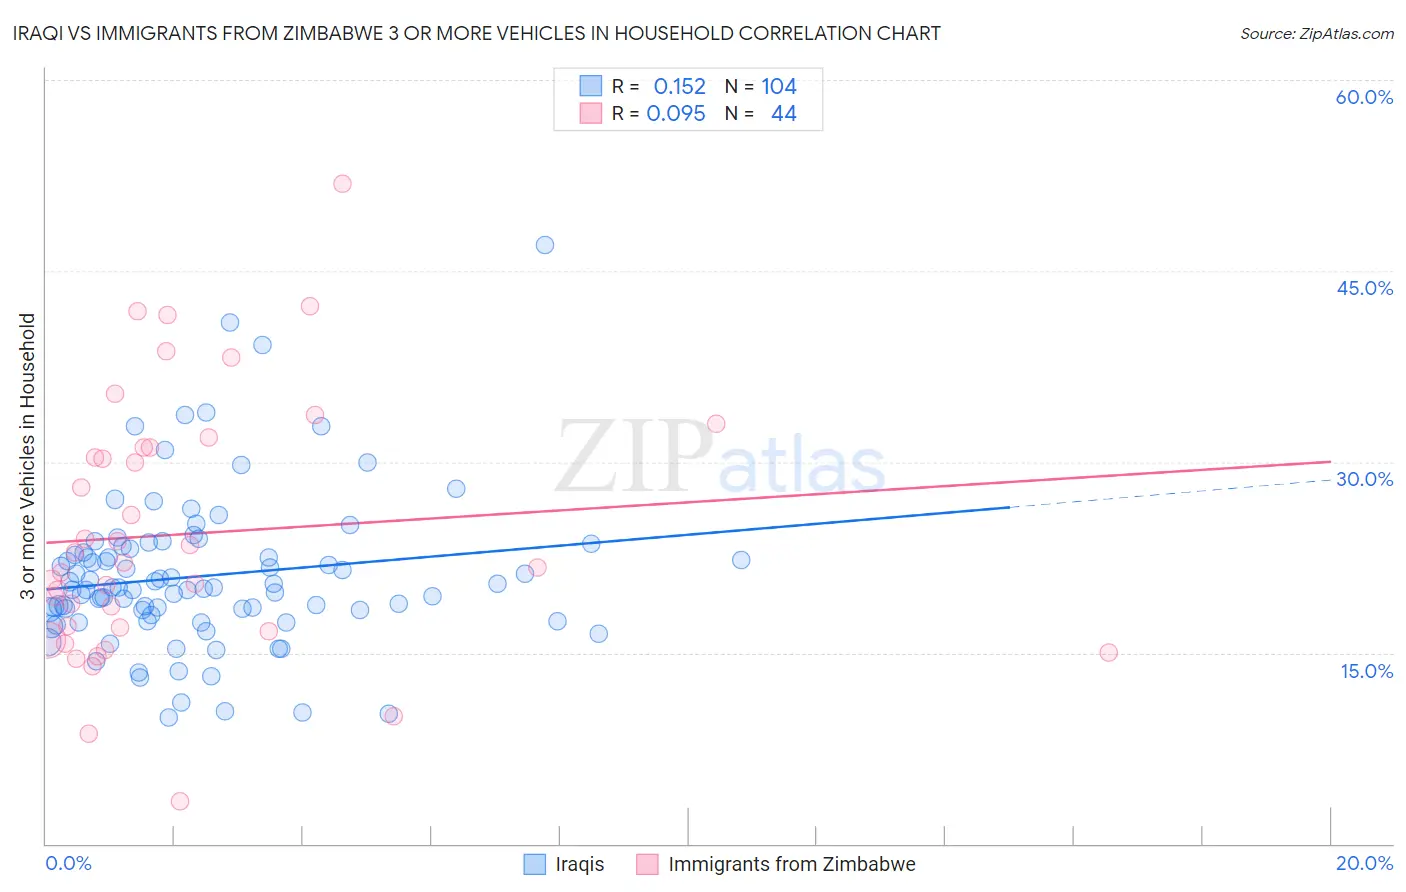
Iraqi vs Immigrants from Zimbabwe 3 or more Vehicles in Household Correlation Chart
The statistical analysis conducted on geographies consisting of 170,599,174 people shows a poor positive correlation between the proportion of Iraqis and percentage of households with 3 or more vehicles available in the United States with a correlation coefficient (R) of 0.152 and weighted average of 19.6%. Similarly, the statistical analysis conducted on geographies consisting of 117,785,307 people shows a slight positive correlation between the proportion of Immigrants from Zimbabwe and percentage of households with 3 or more vehicles available in the United States with a correlation coefficient (R) of 0.095 and weighted average of 19.1%, a difference of 2.5%.
3 or more Vehicles in Household Correlation Summary
| Measurement | Iraqi | Immigrants from Zimbabwe |
| Minimum | 9.9% | 3.3% |
| Maximum | 47.1% | 51.9% |
| Range | 37.2% | 48.5% |
| Mean | 21.0% | 24.3% |
| Median | 20.1% | 21.9% |
| Interquartile 25% (IQ1) | 18.1% | 16.8% |
| Interquartile 75% (IQ3) | 23.0% | 31.1% |
| Interquartile Range (IQR) | 4.9% | 14.3% |
| Standard Deviation (Sample) | 6.1% | 10.2% |
| Standard Deviation (Population) | 6.1% | 10.1% |
Demographics Similar to Iraqis and Immigrants from Zimbabwe by 3 or more Vehicles in Household
In terms of 3 or more vehicles in household, the demographic groups most similar to Iraqis are Immigrants from Western Europe (19.5%, a difference of 0.21%), Kiowa (19.5%, a difference of 0.39%), Immigrants from Northern Europe (19.5%, a difference of 0.44%), Immigrants from South Africa (19.5%, a difference of 0.46%), and Syrian (19.5%, a difference of 0.68%). Similarly, the demographic groups most similar to Immigrants from Zimbabwe are Indian (Asian) (19.1%, a difference of 0.050%), Immigrants from Kuwait (19.1%, a difference of 0.060%), Immigrants from Hong Kong (19.2%, a difference of 0.28%), Immigrants from Sweden (19.2%, a difference of 0.34%), and Immigrants from Sri Lanka (19.2%, a difference of 0.50%).
| Demographics | Rating | Rank | 3 or more Vehicles in Household |
| Iraqis | 56.0 /100 | #170 | Average 19.6% |
| Immigrants | Western Europe | 53.2 /100 | #171 | Average 19.5% |
| Kiowa | 50.9 /100 | #172 | Average 19.5% |
| Immigrants | Northern Europe | 50.2 /100 | #173 | Average 19.5% |
| Immigrants | South Africa | 50.0 /100 | #174 | Average 19.5% |
| Syrians | 47.0 /100 | #175 | Average 19.5% |
| Iroquois | 46.0 /100 | #176 | Average 19.4% |
| Immigrants | Peru | 41.1 /100 | #177 | Average 19.4% |
| Immigrants | Syria | 40.3 /100 | #178 | Average 19.4% |
| Immigrants | South Central Asia | 38.9 /100 | #179 | Fair 19.3% |
| South Africans | 37.5 /100 | #180 | Fair 19.3% |
| Romanians | 37.1 /100 | #181 | Fair 19.3% |
| Cubans | 36.6 /100 | #182 | Fair 19.3% |
| Cajuns | 36.0 /100 | #183 | Fair 19.3% |
| Latvians | 35.7 /100 | #184 | Fair 19.3% |
| Immigrants | Sri Lanka | 30.7 /100 | #185 | Fair 19.2% |
| Immigrants | Sweden | 29.0 /100 | #186 | Fair 19.2% |
| Immigrants | Hong Kong | 28.3 /100 | #187 | Fair 19.2% |
| Immigrants | Kuwait | 26.1 /100 | #188 | Fair 19.1% |
| Indians (Asian) | 26.0 /100 | #189 | Fair 19.1% |
| Immigrants | Zimbabwe | 25.5 /100 | #190 | Fair 19.1% |