Immigrants from Russia vs Immigrants from Caribbean 2 or more Vehicles in Household
COMPARE
Immigrants from Russia
Immigrants from Caribbean
2 or more Vehicles in Household
2 or more Vehicles in Household Comparison
Immigrants from Russia
Immigrants from Caribbean
50.3%
2 OR MORE VEHICLES IN HOUSEHOLD
0.0/ 100
METRIC RATING
300th/ 347
METRIC RANK
44.2%
2 OR MORE VEHICLES IN HOUSEHOLD
0.0/ 100
METRIC RATING
323rd/ 347
METRIC RANK
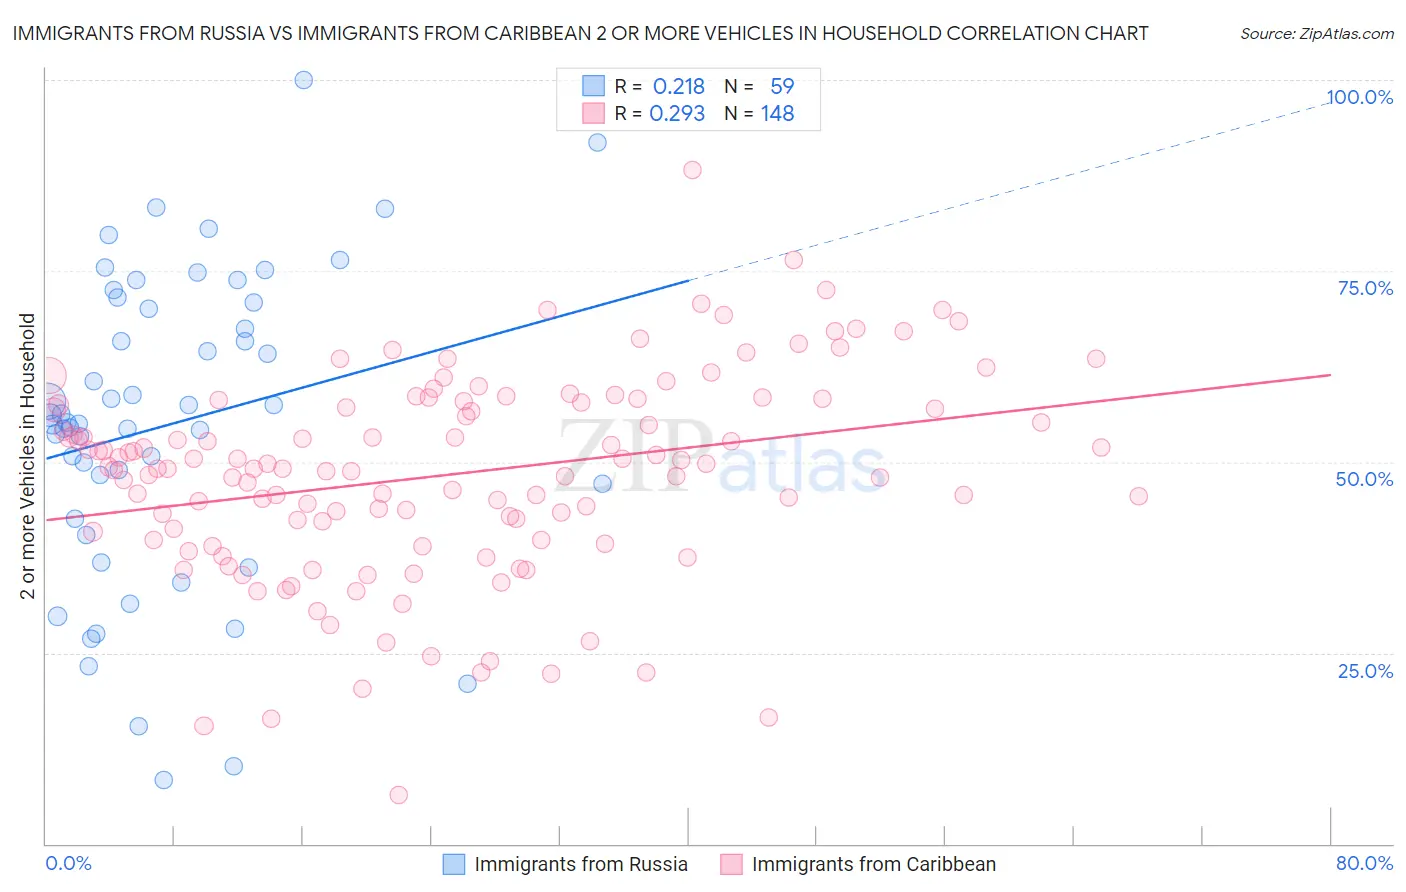
Immigrants from Russia vs Immigrants from Caribbean 2 or more Vehicles in Household Correlation Chart
The statistical analysis conducted on geographies consisting of 347,736,627 people shows a weak positive correlation between the proportion of Immigrants from Russia and percentage of households with 2 or more vehicles available in the United States with a correlation coefficient (R) of 0.218 and weighted average of 50.3%. Similarly, the statistical analysis conducted on geographies consisting of 449,714,597 people shows a weak positive correlation between the proportion of Immigrants from Caribbean and percentage of households with 2 or more vehicles available in the United States with a correlation coefficient (R) of 0.293 and weighted average of 44.2%, a difference of 13.8%.
2 or more Vehicles in Household Correlation Summary
| Measurement | Immigrants from Russia | Immigrants from Caribbean |
| Minimum | 8.3% | 6.4% |
| Maximum | 100.0% | 88.2% |
| Range | 91.7% | 81.8% |
| Mean | 54.9% | 48.3% |
| Median | 55.2% | 49.1% |
| Interquartile 25% (IQ1) | 42.6% | 40.3% |
| Interquartile 75% (IQ3) | 70.9% | 57.6% |
| Interquartile Range (IQR) | 28.3% | 17.3% |
| Standard Deviation (Sample) | 20.1% | 13.3% |
| Standard Deviation (Population) | 19.9% | 13.3% |
Similar Demographics by 2 or more Vehicles in Household
Demographics Similar to Immigrants from Russia by 2 or more Vehicles in Household
In terms of 2 or more vehicles in household, the demographic groups most similar to Immigrants from Russia are Immigrants from Morocco (50.3%, a difference of 0.040%), Paraguayan (50.3%, a difference of 0.070%), Immigrants from Greece (50.2%, a difference of 0.18%), Immigrants from Spain (50.4%, a difference of 0.20%), and Immigrants from South America (50.2%, a difference of 0.24%).
| Demographics | Rating | Rank | 2 or more Vehicles in Household |
| Blacks/African Americans | 0.0 /100 | #293 | Tragic 50.9% |
| Bermudans | 0.0 /100 | #294 | Tragic 50.6% |
| Cypriots | 0.0 /100 | #295 | Tragic 50.6% |
| Immigrants | Somalia | 0.0 /100 | #296 | Tragic 50.5% |
| Immigrants | Spain | 0.0 /100 | #297 | Tragic 50.4% |
| Paraguayans | 0.0 /100 | #298 | Tragic 50.3% |
| Immigrants | Morocco | 0.0 /100 | #299 | Tragic 50.3% |
| Immigrants | Russia | 0.0 /100 | #300 | Tragic 50.3% |
| Immigrants | Greece | 0.0 /100 | #301 | Tragic 50.2% |
| Immigrants | South America | 0.0 /100 | #302 | Tragic 50.2% |
| Tohono O'odham | 0.0 /100 | #303 | Tragic 50.0% |
| Immigrants | Belize | 0.0 /100 | #304 | Tragic 49.9% |
| Immigrants | Western Africa | 0.0 /100 | #305 | Tragic 49.4% |
| Immigrants | Israel | 0.0 /100 | #306 | Tragic 49.2% |
| Hopi | 0.0 /100 | #307 | Tragic 49.0% |
Demographics Similar to Immigrants from Caribbean by 2 or more Vehicles in Household
In terms of 2 or more vehicles in household, the demographic groups most similar to Immigrants from Caribbean are Senegalese (44.2%, a difference of 0.020%), Immigrants from Jamaica (44.5%, a difference of 0.57%), Immigrants from Cabo Verde (43.3%, a difference of 2.1%), Immigrants from West Indies (43.1%, a difference of 2.6%), and Immigrants from Senegal (43.0%, a difference of 2.8%).
| Demographics | Rating | Rank | 2 or more Vehicles in Household |
| Cape Verdeans | 0.0 /100 | #316 | Tragic 46.8% |
| Immigrants | Haiti | 0.0 /100 | #317 | Tragic 46.5% |
| Immigrants | Albania | 0.0 /100 | #318 | Tragic 46.0% |
| Jamaicans | 0.0 /100 | #319 | Tragic 45.8% |
| Soviet Union | 0.0 /100 | #320 | Tragic 45.7% |
| Immigrants | Jamaica | 0.0 /100 | #321 | Tragic 44.5% |
| Senegalese | 0.0 /100 | #322 | Tragic 44.2% |
| Immigrants | Caribbean | 0.0 /100 | #323 | Tragic 44.2% |
| Immigrants | Cabo Verde | 0.0 /100 | #324 | Tragic 43.3% |
| Immigrants | West Indies | 0.0 /100 | #325 | Tragic 43.1% |
| Immigrants | Senegal | 0.0 /100 | #326 | Tragic 43.0% |
| Immigrants | Yemen | 0.0 /100 | #327 | Tragic 42.8% |
| Inupiat | 0.0 /100 | #328 | Tragic 42.6% |
| Ecuadorians | 0.0 /100 | #329 | Tragic 42.0% |
| Immigrants | Dominica | 0.0 /100 | #330 | Tragic 41.6% |