Immigrants from Russia vs Lithuanian 2 or more Vehicles in Household
COMPARE
Immigrants from Russia
Lithuanian
2 or more Vehicles in Household
2 or more Vehicles in Household Comparison
Immigrants from Russia
Lithuanians
50.3%
2 OR MORE VEHICLES IN HOUSEHOLD
0.0/ 100
METRIC RATING
300th/ 347
METRIC RANK
58.2%
2 OR MORE VEHICLES IN HOUSEHOLD
99.5/ 100
METRIC RATING
78th/ 347
METRIC RANK
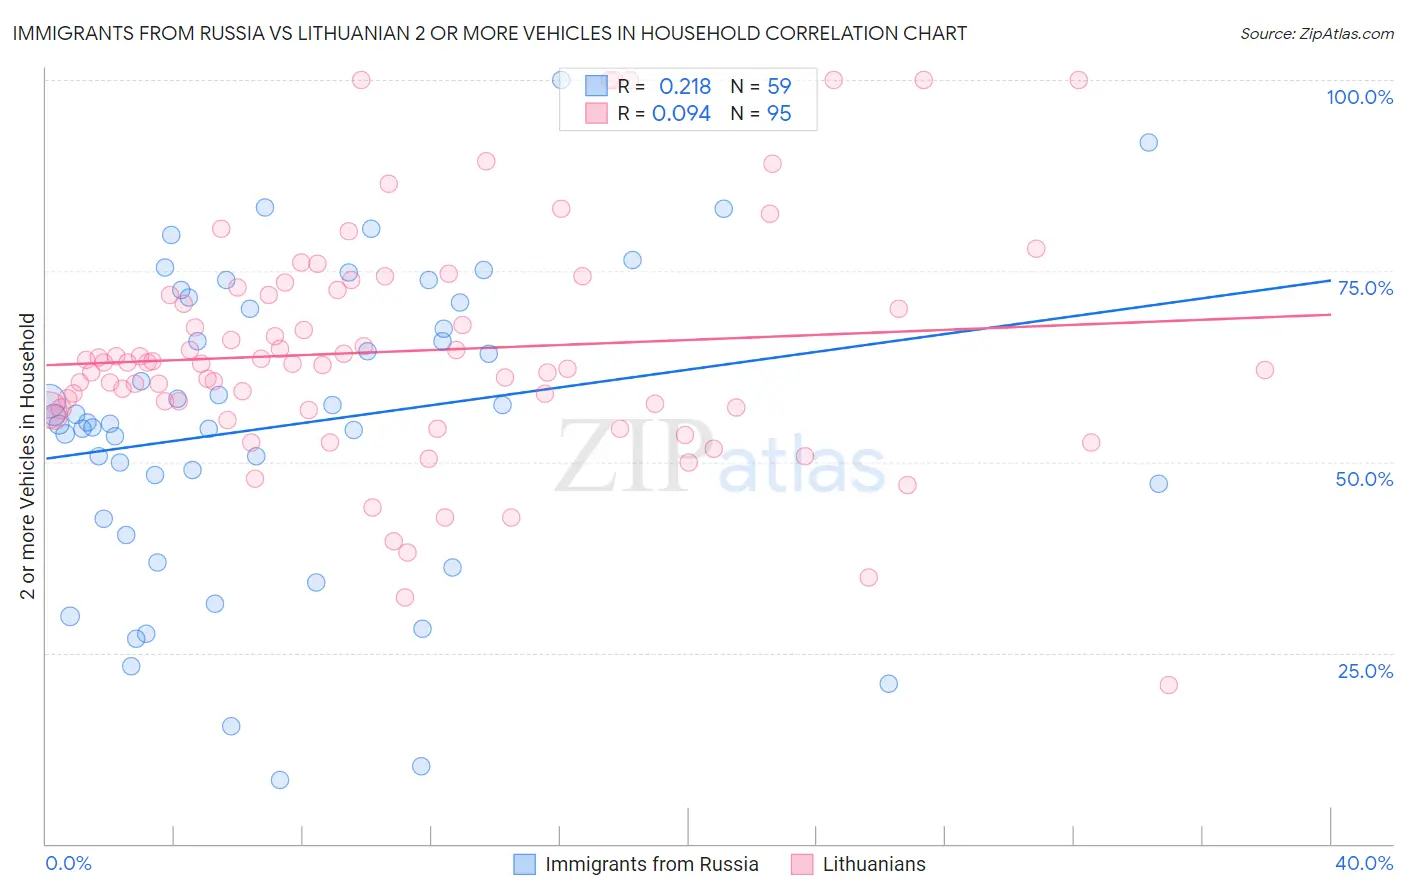
Immigrants from Russia vs Lithuanian 2 or more Vehicles in Household Correlation Chart
The statistical analysis conducted on geographies consisting of 347,736,627 people shows a weak positive correlation between the proportion of Immigrants from Russia and percentage of households with 2 or more vehicles available in the United States with a correlation coefficient (R) of 0.218 and weighted average of 50.3%. Similarly, the statistical analysis conducted on geographies consisting of 421,771,699 people shows a slight positive correlation between the proportion of Lithuanians and percentage of households with 2 or more vehicles available in the United States with a correlation coefficient (R) of 0.094 and weighted average of 58.2%, a difference of 15.8%.
2 or more Vehicles in Household Correlation Summary
| Measurement | Immigrants from Russia | Lithuanian |
| Minimum | 8.3% | 20.9% |
| Maximum | 100.0% | 100.0% |
| Range | 91.7% | 79.1% |
| Mean | 54.9% | 64.5% |
| Median | 55.2% | 62.8% |
| Interquartile 25% (IQ1) | 42.6% | 56.8% |
| Interquartile 75% (IQ3) | 70.9% | 72.5% |
| Interquartile Range (IQR) | 28.3% | 15.7% |
| Standard Deviation (Sample) | 20.1% | 15.4% |
| Standard Deviation (Population) | 19.9% | 15.4% |
Similar Demographics by 2 or more Vehicles in Household
Demographics Similar to Immigrants from Russia by 2 or more Vehicles in Household
In terms of 2 or more vehicles in household, the demographic groups most similar to Immigrants from Russia are Immigrants from Morocco (50.3%, a difference of 0.040%), Paraguayan (50.3%, a difference of 0.070%), Immigrants from Greece (50.2%, a difference of 0.18%), Immigrants from Spain (50.4%, a difference of 0.20%), and Immigrants from South America (50.2%, a difference of 0.24%).
| Demographics | Rating | Rank | 2 or more Vehicles in Household |
| Blacks/African Americans | 0.0 /100 | #293 | Tragic 50.9% |
| Bermudans | 0.0 /100 | #294 | Tragic 50.6% |
| Cypriots | 0.0 /100 | #295 | Tragic 50.6% |
| Immigrants | Somalia | 0.0 /100 | #296 | Tragic 50.5% |
| Immigrants | Spain | 0.0 /100 | #297 | Tragic 50.4% |
| Paraguayans | 0.0 /100 | #298 | Tragic 50.3% |
| Immigrants | Morocco | 0.0 /100 | #299 | Tragic 50.3% |
| Immigrants | Russia | 0.0 /100 | #300 | Tragic 50.3% |
| Immigrants | Greece | 0.0 /100 | #301 | Tragic 50.2% |
| Immigrants | South America | 0.0 /100 | #302 | Tragic 50.2% |
| Tohono O'odham | 0.0 /100 | #303 | Tragic 50.0% |
| Immigrants | Belize | 0.0 /100 | #304 | Tragic 49.9% |
| Immigrants | Western Africa | 0.0 /100 | #305 | Tragic 49.4% |
| Immigrants | Israel | 0.0 /100 | #306 | Tragic 49.2% |
| Hopi | 0.0 /100 | #307 | Tragic 49.0% |
Demographics Similar to Lithuanians by 2 or more Vehicles in Household
In terms of 2 or more vehicles in household, the demographic groups most similar to Lithuanians are Slovene (58.3%, a difference of 0.050%), Creek (58.3%, a difference of 0.060%), Delaware (58.2%, a difference of 0.080%), Polish (58.3%, a difference of 0.10%), and Immigrants from Afghanistan (58.3%, a difference of 0.17%).
| Demographics | Rating | Rank | 2 or more Vehicles in Household |
| Bangladeshis | 99.6 /100 | #71 | Exceptional 58.4% |
| Austrians | 99.6 /100 | #72 | Exceptional 58.4% |
| Bolivians | 99.6 /100 | #73 | Exceptional 58.3% |
| Immigrants | Afghanistan | 99.6 /100 | #74 | Exceptional 58.3% |
| Poles | 99.5 /100 | #75 | Exceptional 58.3% |
| Creek | 99.5 /100 | #76 | Exceptional 58.3% |
| Slovenes | 99.5 /100 | #77 | Exceptional 58.3% |
| Lithuanians | 99.5 /100 | #78 | Exceptional 58.2% |
| Delaware | 99.4 /100 | #79 | Exceptional 58.2% |
| Immigrants | England | 99.3 /100 | #80 | Exceptional 58.1% |
| Immigrants | Iraq | 99.3 /100 | #81 | Exceptional 58.1% |
| Iranians | 99.3 /100 | #82 | Exceptional 58.1% |
| Icelanders | 99.2 /100 | #83 | Exceptional 58.0% |
| Maltese | 99.2 /100 | #84 | Exceptional 58.0% |
| Slovaks | 99.2 /100 | #85 | Exceptional 58.0% |