Immigrants from Russia vs Spaniard 2 or more Vehicles in Household
COMPARE
Immigrants from Russia
Spaniard
2 or more Vehicles in Household
2 or more Vehicles in Household Comparison
Immigrants from Russia
Spaniards
50.3%
2 OR MORE VEHICLES IN HOUSEHOLD
0.0/ 100
METRIC RATING
300th/ 347
METRIC RANK
59.2%
2 OR MORE VEHICLES IN HOUSEHOLD
99.9/ 100
METRIC RATING
51st/ 347
METRIC RANK
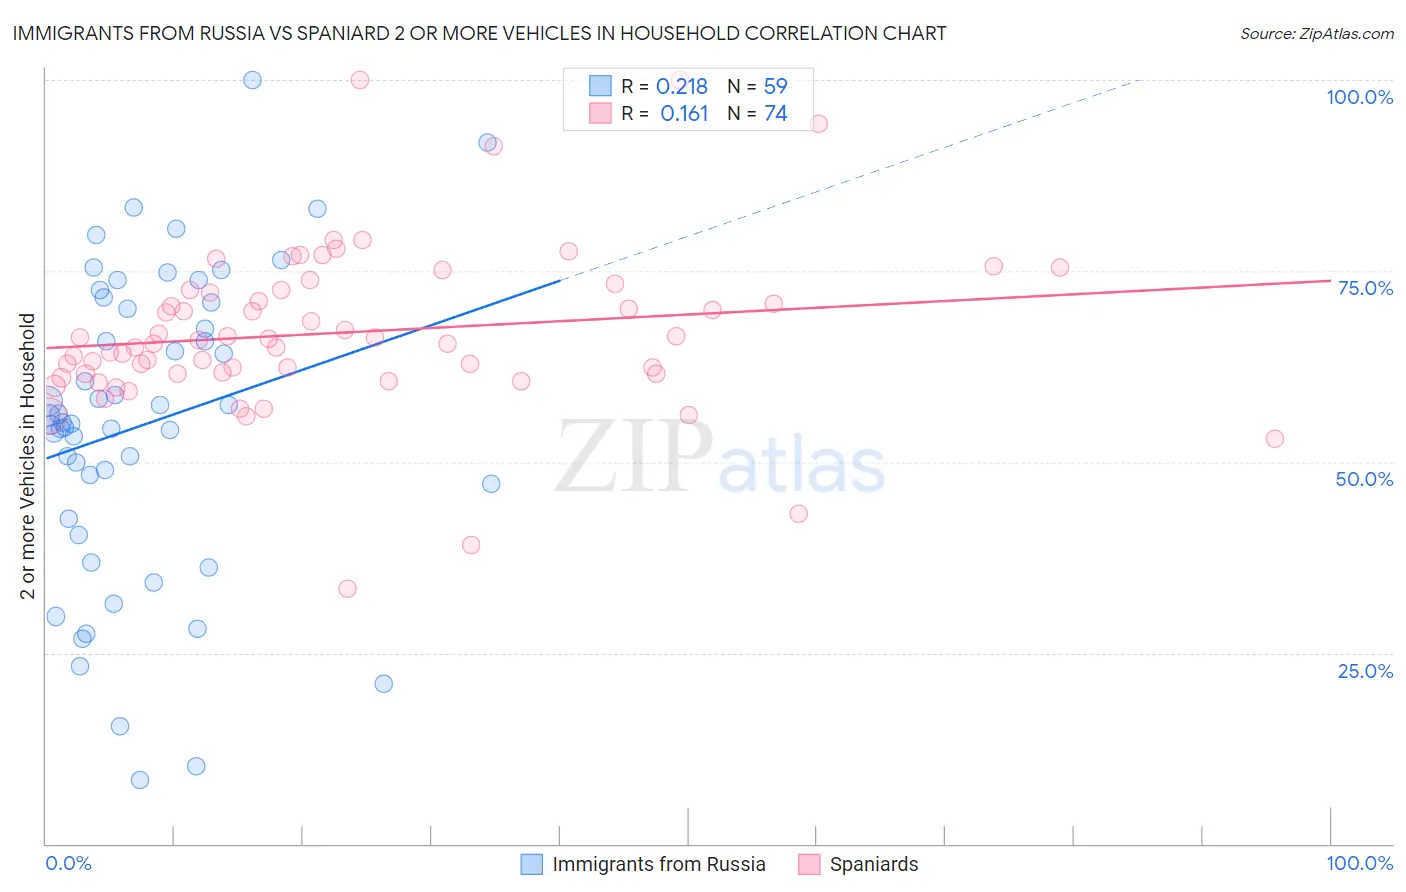
Immigrants from Russia vs Spaniard 2 or more Vehicles in Household Correlation Chart
The statistical analysis conducted on geographies consisting of 347,736,627 people shows a weak positive correlation between the proportion of Immigrants from Russia and percentage of households with 2 or more vehicles available in the United States with a correlation coefficient (R) of 0.218 and weighted average of 50.3%. Similarly, the statistical analysis conducted on geographies consisting of 443,212,223 people shows a poor positive correlation between the proportion of Spaniards and percentage of households with 2 or more vehicles available in the United States with a correlation coefficient (R) of 0.161 and weighted average of 59.2%, a difference of 17.6%.
2 or more Vehicles in Household Correlation Summary
| Measurement | Immigrants from Russia | Spaniard |
| Minimum | 8.3% | 33.3% |
| Maximum | 100.0% | 100.0% |
| Range | 91.7% | 66.7% |
| Mean | 54.9% | 66.9% |
| Median | 55.2% | 65.8% |
| Interquartile 25% (IQ1) | 42.6% | 61.6% |
| Interquartile 75% (IQ3) | 70.9% | 72.4% |
| Interquartile Range (IQR) | 28.3% | 10.9% |
| Standard Deviation (Sample) | 20.1% | 11.0% |
| Standard Deviation (Population) | 19.9% | 10.9% |
Similar Demographics by 2 or more Vehicles in Household
Demographics Similar to Immigrants from Russia by 2 or more Vehicles in Household
In terms of 2 or more vehicles in household, the demographic groups most similar to Immigrants from Russia are Immigrants from Morocco (50.3%, a difference of 0.040%), Paraguayan (50.3%, a difference of 0.070%), Immigrants from Greece (50.2%, a difference of 0.18%), Immigrants from Spain (50.4%, a difference of 0.20%), and Immigrants from South America (50.2%, a difference of 0.24%).
| Demographics | Rating | Rank | 2 or more Vehicles in Household |
| Blacks/African Americans | 0.0 /100 | #293 | Tragic 50.9% |
| Bermudans | 0.0 /100 | #294 | Tragic 50.6% |
| Cypriots | 0.0 /100 | #295 | Tragic 50.6% |
| Immigrants | Somalia | 0.0 /100 | #296 | Tragic 50.5% |
| Immigrants | Spain | 0.0 /100 | #297 | Tragic 50.4% |
| Paraguayans | 0.0 /100 | #298 | Tragic 50.3% |
| Immigrants | Morocco | 0.0 /100 | #299 | Tragic 50.3% |
| Immigrants | Russia | 0.0 /100 | #300 | Tragic 50.3% |
| Immigrants | Greece | 0.0 /100 | #301 | Tragic 50.2% |
| Immigrants | South America | 0.0 /100 | #302 | Tragic 50.2% |
| Tohono O'odham | 0.0 /100 | #303 | Tragic 50.0% |
| Immigrants | Belize | 0.0 /100 | #304 | Tragic 49.9% |
| Immigrants | Western Africa | 0.0 /100 | #305 | Tragic 49.4% |
| Immigrants | Israel | 0.0 /100 | #306 | Tragic 49.2% |
| Hopi | 0.0 /100 | #307 | Tragic 49.0% |
Demographics Similar to Spaniards by 2 or more Vehicles in Household
In terms of 2 or more vehicles in household, the demographic groups most similar to Spaniards are Immigrants from Laos (59.2%, a difference of 0.0%), Celtic (59.2%, a difference of 0.020%), Choctaw (59.3%, a difference of 0.14%), Belgian (59.3%, a difference of 0.15%), and Bhutanese (59.1%, a difference of 0.16%).
| Demographics | Rating | Rank | 2 or more Vehicles in Household |
| French | 100.0 /100 | #44 | Exceptional 59.8% |
| Immigrants | Taiwan | 100.0 /100 | #45 | Exceptional 59.7% |
| Immigrants | South Eastern Asia | 100.0 /100 | #46 | Exceptional 59.6% |
| Yaqui | 99.9 /100 | #47 | Exceptional 59.3% |
| Immigrants | India | 99.9 /100 | #48 | Exceptional 59.3% |
| Belgians | 99.9 /100 | #49 | Exceptional 59.3% |
| Choctaw | 99.9 /100 | #50 | Exceptional 59.3% |
| Spaniards | 99.9 /100 | #51 | Exceptional 59.2% |
| Immigrants | Laos | 99.9 /100 | #52 | Exceptional 59.2% |
| Celtics | 99.9 /100 | #53 | Exceptional 59.2% |
| Bhutanese | 99.9 /100 | #54 | Exceptional 59.1% |
| Luxembourgers | 99.9 /100 | #55 | Exceptional 59.1% |
| Chickasaw | 99.9 /100 | #56 | Exceptional 59.0% |
| Afghans | 99.9 /100 | #57 | Exceptional 59.0% |
| Immigrants | Scotland | 99.8 /100 | #58 | Exceptional 58.9% |