Immigrants from Russia vs Immigrants from Africa 3 or more Vehicles in Household
COMPARE
Immigrants from Russia
Immigrants from Africa
3 or more Vehicles in Household
3 or more Vehicles in Household Comparison
Immigrants from Russia
Immigrants from Africa
16.9%
3 OR MORE VEHICLES IN HOUSEHOLD
0.1/ 100
METRIC RATING
295th/ 347
METRIC RANK
17.6%
3 OR MORE VEHICLES IN HOUSEHOLD
0.5/ 100
METRIC RATING
272nd/ 347
METRIC RANK
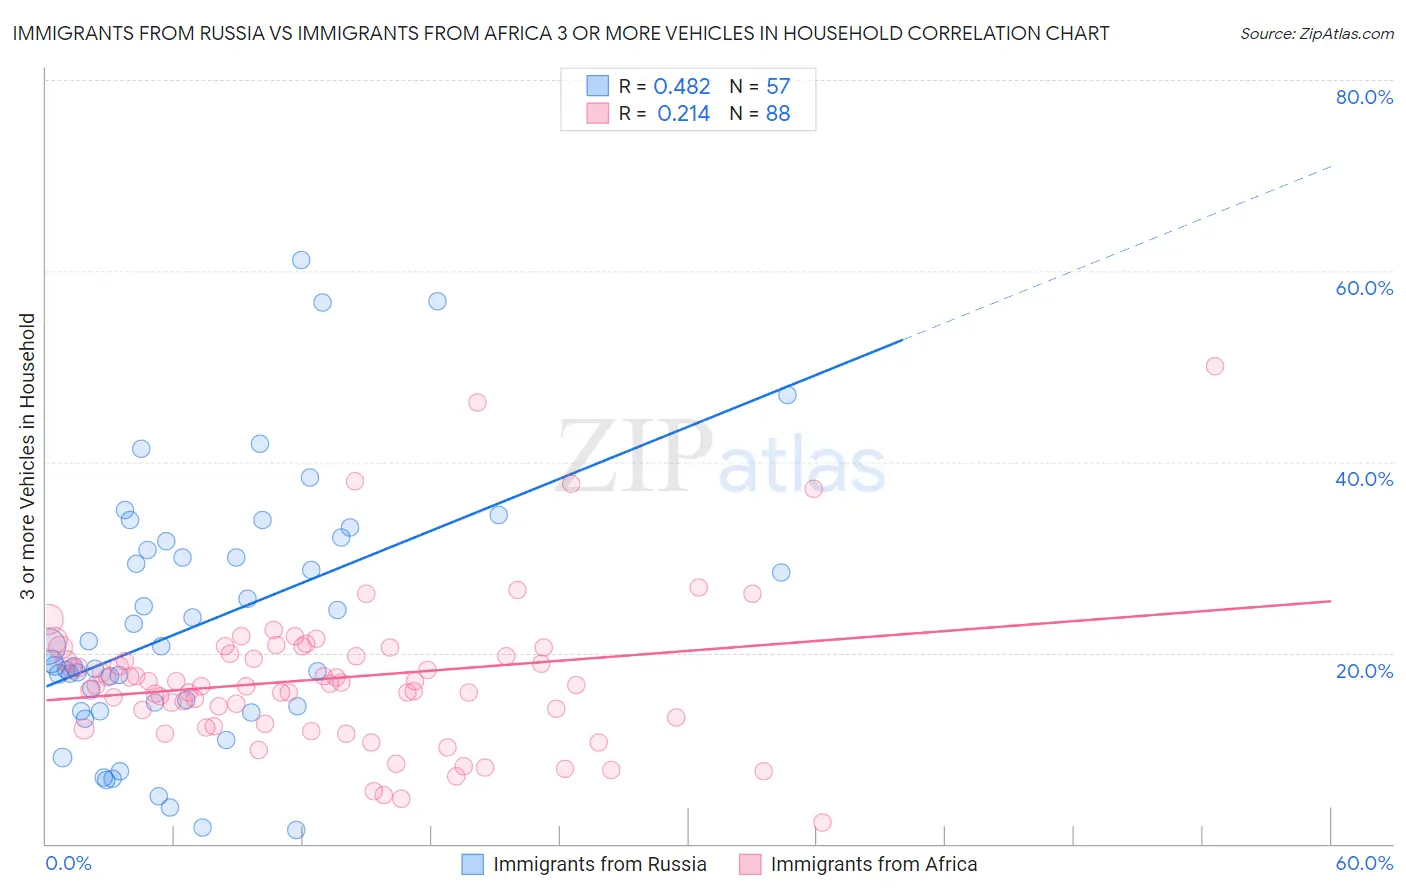
Immigrants from Russia vs Immigrants from Africa 3 or more Vehicles in Household Correlation Chart
The statistical analysis conducted on geographies consisting of 347,621,563 people shows a moderate positive correlation between the proportion of Immigrants from Russia and percentage of households with 3 or more vehicles available in the United States with a correlation coefficient (R) of 0.482 and weighted average of 16.9%. Similarly, the statistical analysis conducted on geographies consisting of 468,754,030 people shows a weak positive correlation between the proportion of Immigrants from Africa and percentage of households with 3 or more vehicles available in the United States with a correlation coefficient (R) of 0.214 and weighted average of 17.6%, a difference of 3.8%.
3 or more Vehicles in Household Correlation Summary
| Measurement | Immigrants from Russia | Immigrants from Africa |
| Minimum | 1.4% | 2.2% |
| Maximum | 61.1% | 50.0% |
| Range | 59.7% | 47.8% |
| Mean | 23.0% | 17.4% |
| Median | 19.1% | 16.7% |
| Interquartile 25% (IQ1) | 14.1% | 12.9% |
| Interquartile 75% (IQ3) | 31.2% | 20.2% |
| Interquartile Range (IQR) | 17.1% | 7.3% |
| Standard Deviation (Sample) | 13.5% | 8.0% |
| Standard Deviation (Population) | 13.3% | 7.9% |
Similar Demographics by 3 or more Vehicles in Household
Demographics Similar to Immigrants from Russia by 3 or more Vehicles in Household
In terms of 3 or more vehicles in household, the demographic groups most similar to Immigrants from Russia are Immigrants from Western Africa (16.9%, a difference of 0.050%), Bahamian (16.9%, a difference of 0.16%), Immigrants from Spain (17.0%, a difference of 0.25%), Immigrants from Congo (17.0%, a difference of 0.36%), and Inupiat (16.9%, a difference of 0.36%).
| Demographics | Rating | Rank | 3 or more Vehicles in Household |
| Immigrants | Uruguay | 0.2 /100 | #288 | Tragic 17.1% |
| Immigrants | Liberia | 0.1 /100 | #289 | Tragic 17.1% |
| Liberians | 0.1 /100 | #290 | Tragic 17.0% |
| Immigrants | Congo | 0.1 /100 | #291 | Tragic 17.0% |
| Immigrants | Spain | 0.1 /100 | #292 | Tragic 17.0% |
| Bahamians | 0.1 /100 | #293 | Tragic 16.9% |
| Immigrants | Western Africa | 0.1 /100 | #294 | Tragic 16.9% |
| Immigrants | Russia | 0.1 /100 | #295 | Tragic 16.9% |
| Inupiat | 0.1 /100 | #296 | Tragic 16.9% |
| Israelis | 0.1 /100 | #297 | Tragic 16.8% |
| Immigrants | Zaire | 0.1 /100 | #298 | Tragic 16.7% |
| Immigrants | South America | 0.1 /100 | #299 | Tragic 16.7% |
| Cypriots | 0.0 /100 | #300 | Tragic 16.6% |
| Paraguayans | 0.0 /100 | #301 | Tragic 16.6% |
| Immigrants | Greece | 0.0 /100 | #302 | Tragic 16.5% |
Demographics Similar to Immigrants from Africa by 3 or more Vehicles in Household
In terms of 3 or more vehicles in household, the demographic groups most similar to Immigrants from Africa are Immigrants from Sudan (17.6%, a difference of 0.040%), Immigrants from Bosnia and Herzegovina (17.5%, a difference of 0.18%), Immigrants from Nepal (17.6%, a difference of 0.41%), South American (17.6%, a difference of 0.41%), and Immigrants from France (17.6%, a difference of 0.46%).
| Demographics | Rating | Rank | 3 or more Vehicles in Household |
| Immigrants | Panama | 0.8 /100 | #265 | Tragic 17.7% |
| Macedonians | 0.8 /100 | #266 | Tragic 17.7% |
| Immigrants | Venezuela | 0.8 /100 | #267 | Tragic 17.7% |
| Immigrants | Bulgaria | 0.8 /100 | #268 | Tragic 17.7% |
| Immigrants | France | 0.6 /100 | #269 | Tragic 17.6% |
| Immigrants | Nepal | 0.6 /100 | #270 | Tragic 17.6% |
| South Americans | 0.6 /100 | #271 | Tragic 17.6% |
| Immigrants | Africa | 0.5 /100 | #272 | Tragic 17.6% |
| Immigrants | Sudan | 0.5 /100 | #273 | Tragic 17.6% |
| Immigrants | Bosnia and Herzegovina | 0.5 /100 | #274 | Tragic 17.5% |
| Immigrants | Ukraine | 0.4 /100 | #275 | Tragic 17.5% |
| Okinawans | 0.4 /100 | #276 | Tragic 17.4% |
| Brazilians | 0.4 /100 | #277 | Tragic 17.4% |
| Immigrants | Bahamas | 0.3 /100 | #278 | Tragic 17.4% |
| Immigrants | Kazakhstan | 0.3 /100 | #279 | Tragic 17.4% |